e-Literate

Present is Prologue

Tag: IPEDS

  • College Scorecard Article Published In Washington Post

    I have written several posts looking at the new College Scorecard and its inherent flaws in the data, often starting with observations from Russ Poulin at WCET. Today Susan Svrluga, education reporter at the Washington Post, posted a new article co-written by me and Russ and titled “Hundreds of colleges missing from Obama’s College Scorecard?”. The gist of the article is taking a holistic view of data problems and why they exist.

    In a nutshell, the College Scorecard combines data from multiple sources – primarily from the Education Department’s own Integrated Postsecondary Education Data System (IPEDS) and National Student Loan Data System (NSLDS) – and publishes the results of both as a consumer-facing Web site and an analyst-friendly data download. The essence of the problem is that throughout this process the data is filtered based on questionable assumptions, leading to the fuzzy lens viewing subsets of the real data.
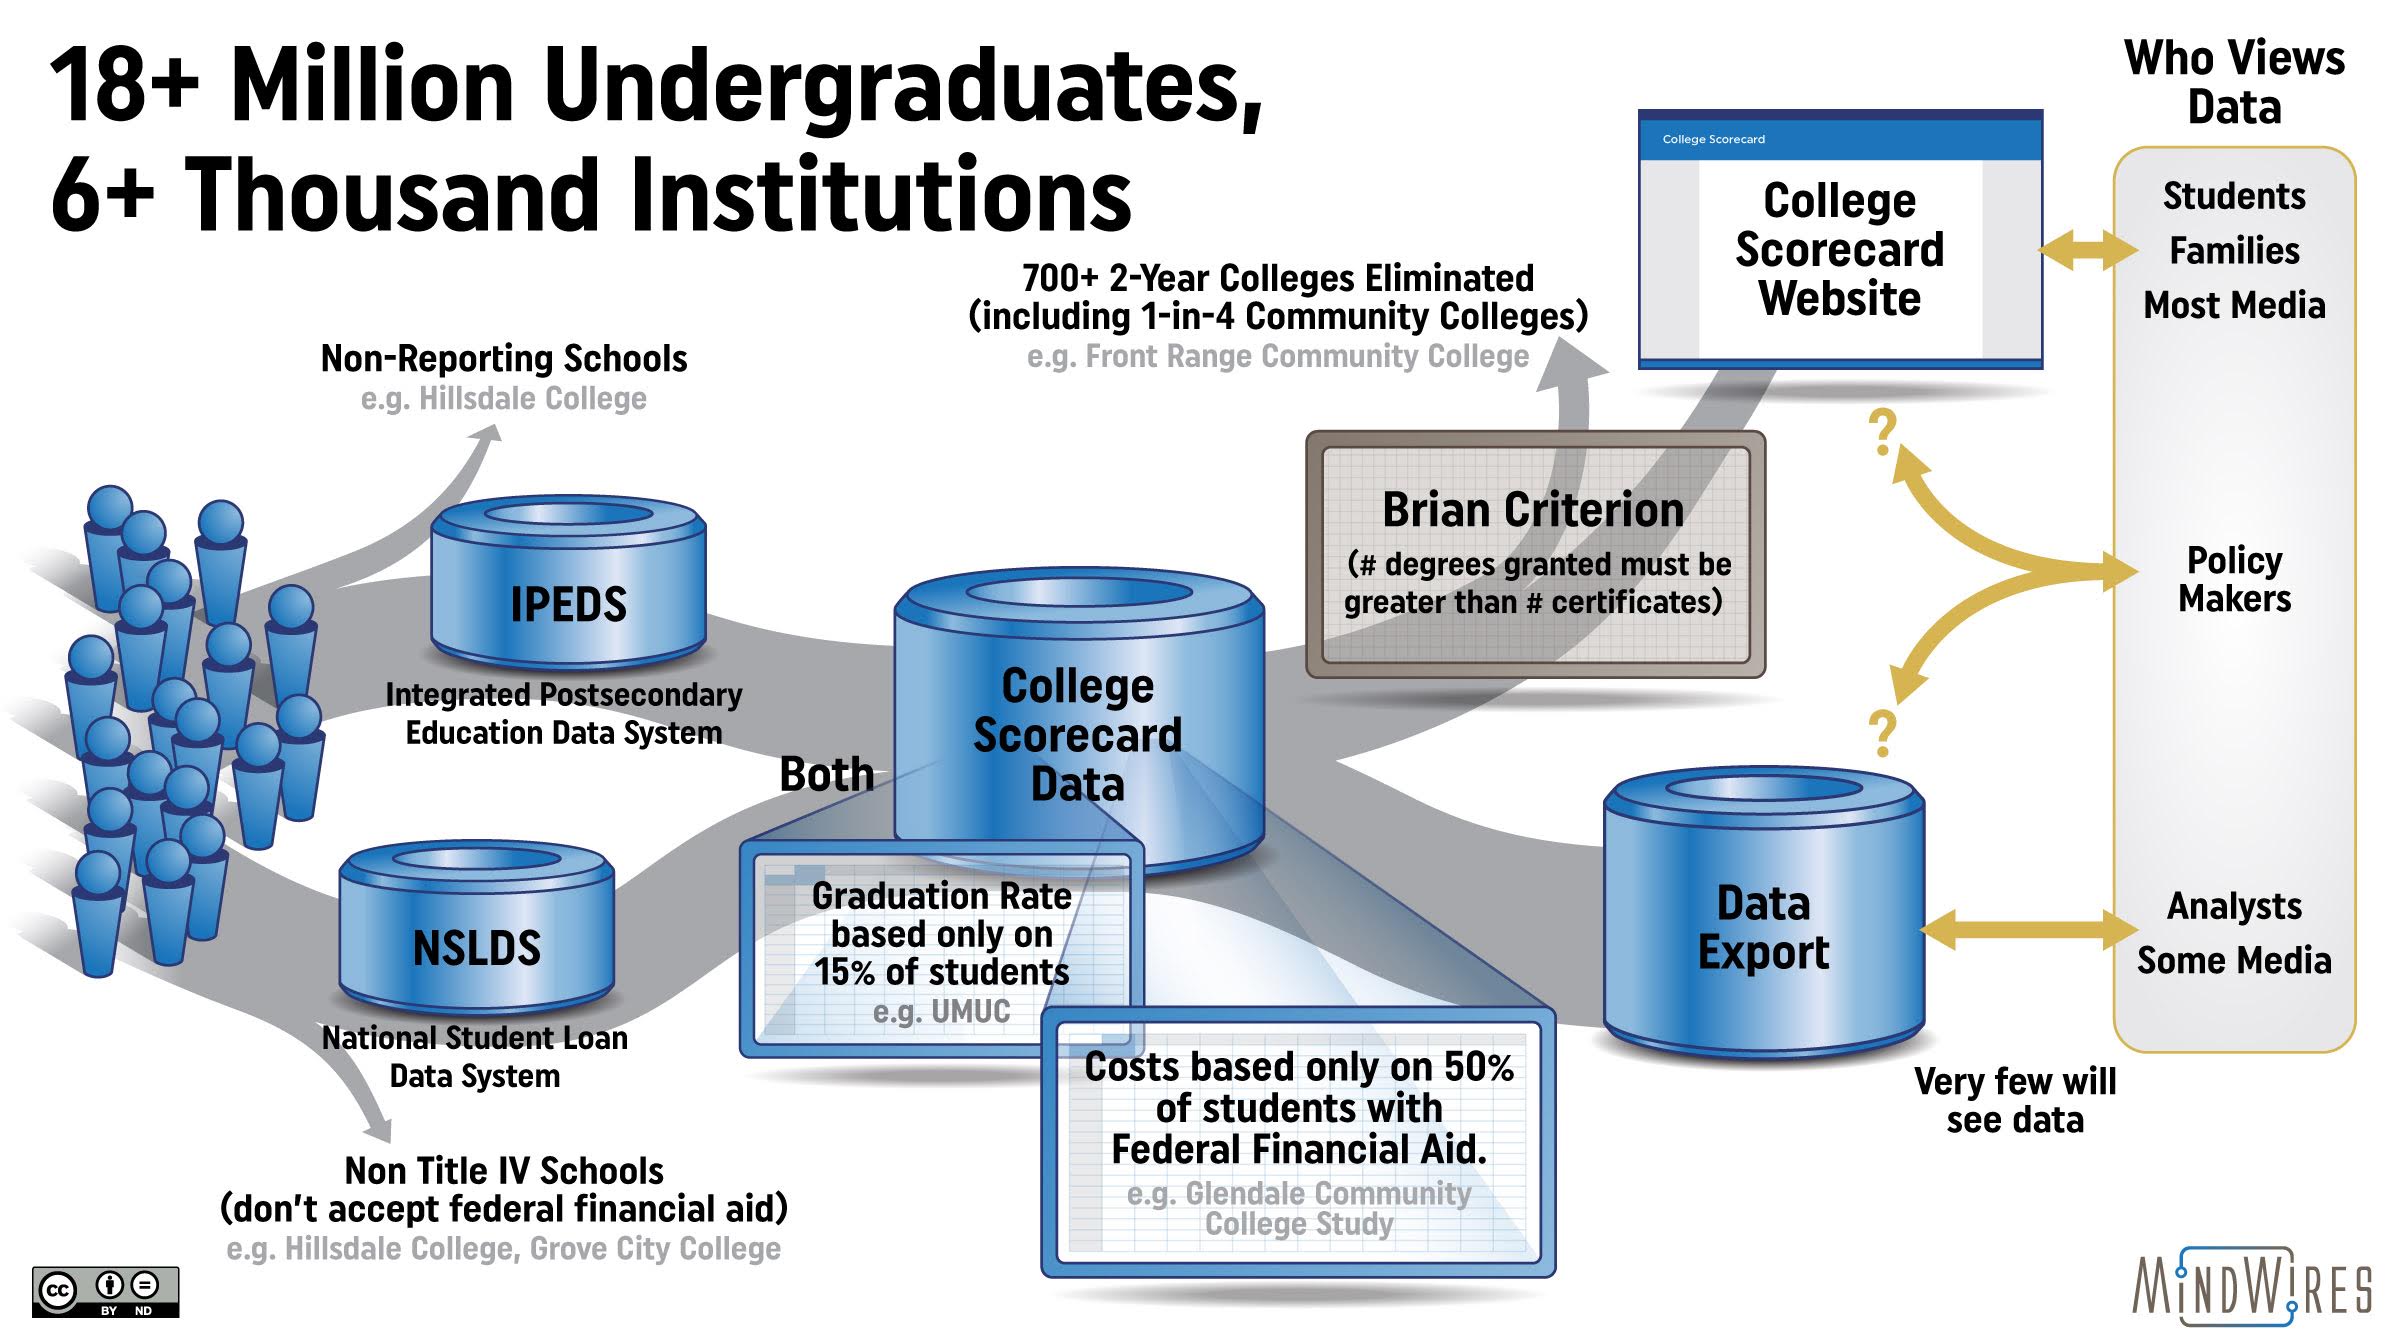
    Poulin Hill College Scorecard Graphic

  • College Scorecard Problem Gets Worse: One in three associate’s degree institutions are not included

    Late yesterday I posted about the Education Department (ED) new College Scorecard and how it omits a large number of community colleges based on an arbitrary metric.

    In particular, the Education Department (ED) is using a questionable method of determining whether an institution is degree-granting rather than relying on the IPEDS data source. In a nutshell, if an institution awarded more certificates than degrees, then it is not labeled as “predominantly awarded 2-year or 4-yeard degrees” and therefore excluded.

    I am not quite confident that the explanation for the vast majority of missing schools is based on this finding. In short, if an institutions awards more certificates than degrees, ED removes them from the public-facing website even if they are technically degree-granting institutions.

    Originally it appeared this situation encompassed 17% of all community colleges, but further analysis shows it to be more significant. (more…)

  • 17% Of Community Colleges Are Not Included In College Scorecard

    In addition to the highly-misleading usage of ‘first-time full-time’ qualification for official graduate rates reported in the College Scorecard, there appears to be another major issue with the data. In particular, the Education Department (ED) is using a questionable method of determining whether an institution is degree-granting rather than relying on the IPEDS data source. In a nutshell, if an institution awarded more certificates than degrees, then it is not labeled as “predominantly awarded 2-year or 4-yeard degrees” and therefore excluded.

    Russ Poulin noted in his WCET post that several community colleges were missing from the Scorecard based on a quick spot check:

    • Colorado – Aims, Front Range, Pueblo, and Otero Community Colleges.
    • Arizona – Rio Salado College.
    • California – Bakersfield College.

    The consumer website itself offers no explanation that certain degree-granting schools are excluded. The Technical Paper that corresponds to the data release explains that selection of schools on page 28: (more…)

  • About the Diverging Textbook Prices and Student Expenditures

    This is part 3 in this series. Part 1 described the most reliable data on A) how much US college textbook prices are rising and B) how much students actually pay for textbooks, showing that the College Board data is not reliable for either measure. Part 2 provided additional detail on the data source (College Board, NCES, NACS, Student Monitor) and their methodologies. Note that the textbook market is moving into a required course materials market, and in the immediate series I use both terms somewhat interchangeably based on which source I’m quoting. They are largely equivalent, but not identical.

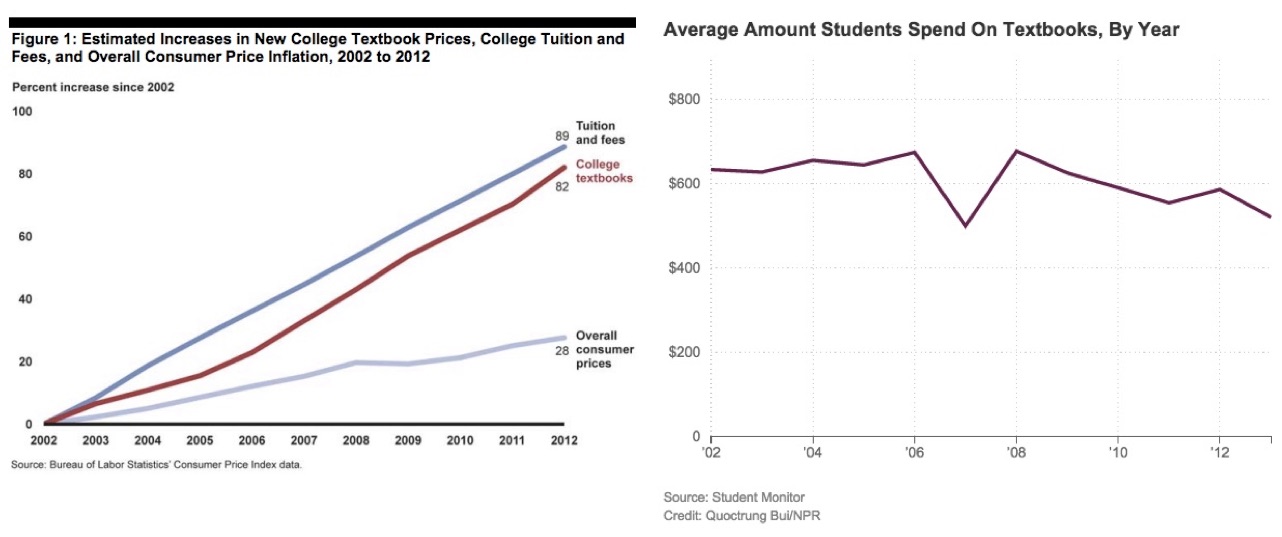
    Based on the most reliable data we have, the average college textbook prices are rising at three times the rate of inflation while average student expenditures on textbooks is remaining flat or even falling, in either case below the rate of inflation. Average student expenditures of approximately $600 per year is about half of what gets commonly reported in the national media. The combined chart comes from this GAO Report (using CPI data) and this NPR report (using Student Monitor data).

    Combined Chart

    Does this indicate a functioning market, and does this indicate that we don’t have a textbook pricing problem? No, and no. (more…)

  • Postscript on Student Textbook Expenditures: More details on data sources

    There has been a fair amount of discussion around my post two days ago about what US postsecondary students actually pay for textbooks.

    The shortest answer is that US college students spend an average of $600 per year on textbooks despite rising retail prices.

    I would not use College Board as a source on this subject, as they do not collect their own data on textbook pricing or expenditures, and they only use budget estimates.

    <wonk> I argued that the two best sources for rising average textbook price are the Bureau of Labor Statistics and the National Association of College Stores (NACS), and when you look at what students actually pay (including rental, non-consumption, etc) the best sources are NACS and Student Monitor. In this post I’ll share more information on the data sources and their methodologies. The purpose is to help people understand what these sources tell us and what they don’t tell us.

    College Board and NPSAS

    My going-in- argument was that the College Board is not a credible source on what students actually pay:

    The College Board is working to help people estimate the total cost of attendance; they are not providing actual source data on textbook costs, nor do they even claim to do so. Reporters and advocates just fail to read the footnotes.

    Both the College Board and National Postsecondary Student Aid Study (NPSAS, official data for the National Center for Education Statistics, or NCES) currently use cost of attendance data created by financial aid offices of each institution, using the category “Books and Supplies”. There is no precise guidance from DOE on the definition of this category, and financial aid offices use very idiosyncratic methods for this budget estimate. Some schools like to maximize the amount of financial aid available to students, so there is motivation to keep this category artificially high. (more…)

  • Babson Study of Online Learning Released

    Babson Survey Research Group (BSRG) just released its annual survey of online learning in US higher education (press release here). This year they have moved from use of survey methodology for the online enrollment section to use of IPEDS distance education data. Russ Poulin from WCET and I provided commentary on the two data sources as an appendix to the study.

    The report highlights the significant drop in growth of online education in the US (which I covered previously in this e-Literate post). Some of the key findings:

    • Previous reports in this series noted the proportion of institutions that believe that online education is a critical component of their long-term strategy has shown small but steady increases for a decade, followed by a retreat in 2013.
    • After years of a consistently growing majority of chief academic officers rating the learning outcomes for online education “as good as or better” than those for face-to-face instruction, the pattern reversed itself last year.
    • This report series has used its own data to chronicle the continued increases in the number of students taking at least one online course. Online enrollments have increased at rates far in excess of those of overall higher education. The pattern, however, has been one of decreasing growth rates over time. This year marks the first use of IPEDS data to examine this trend.
    • While the number of students taking distance courses has grown by the millions over the past decade, it has not come without considerable concerns. Faculty acceptance has lagged, concerns about student retention linger, and leaders continue to worry that online courses require more faculty effort than face-to-face instruction.

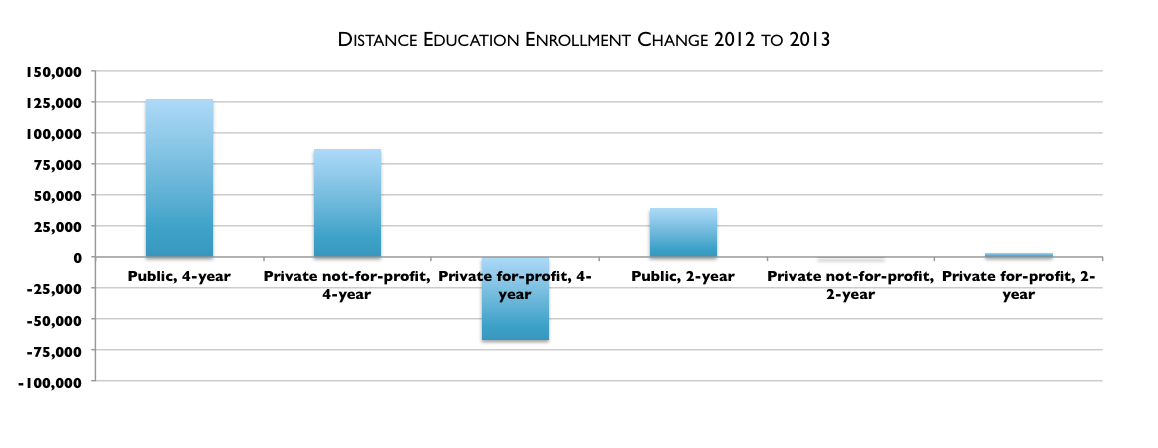
    BSRG looked at the low growth (which I characterized as ‘no discernible’ growth’ due to noise in the data) and broke down trends by sector.

    Growth by sector

    (more…)

  • No Discernible Growth in US Higher Ed Online Learning

    By 2015, 25 million post-secondary students in the United States will be taking classes online. And as that happens, the number of students who take classes exclusively on physical campuses will plummet, from 14.4 million in 2010 to just 4.1 million five years later, according to a new forecast released by market research firm Ambient Insight.

    – Campus Technology, 2011

    On the positive side, Moody’s notes that the U.S. Department of Education projects a 20-percent growth in master’s degrees and a 9-percent growth in associate degrees, opportunities in both online education and new certificate programs, and a rising earnings premium for those with college degrees.

    – Chronicle of Higher Ed, 2014

    Q.  How likely would it be that this fraction [% students taking online courses] would grow to become a majority of students over the next five years? A [from institutional academic leaders]. Nearly two-thirds responded that this was “Very likely,” with an additional one-quarter calling it “Likely.” [That’s almost 90% combined]

    – Grade Change, Babson Survey 2013

    More than two-thirds of instructors (68 percent) say their institutions are planning to expand their online offerings, but they are split on whether or not this is a good idea (36 percent positive, 38 percent negative, 26 percent neutral).

    – Inside Higher Ed 2014

    Still, the [disruptive innovation] theory predicts that, be it steam or online education, existing consumers will ultimately adopt the disruption, and a host of struggling colleges and universities — the bottom 25 percent of every tier, we predict — will disappear or merge in the next 10 to 15 years.

    – Clayton Christensen in NY Times 2013

    You could be forgiven for assuming that the continued growth of online education within US higher ed was a foregone conclusion. We all know it’s happening; the questions is how to adapt to the new world.

    But what if the assumption is wrong? Based on the official Department of Education / NCES new IPEDS data for Fall 2013 term, for the first time there has been no discernible growth in postsecondary students taking at least one online course in the US. (more…)