e-Literate

Present is Prologue

Tag: LMS market

  • MarketsandMarkets: Getting the LMS market wrong

    New LMS market analysis with a leader list that includes a company that is retiring its LMS and ignores the company who has a 5x lead in new implementations for its core market? Sign me up.

    Over the next week or two, we plan several posts at e-Literate based on the various LMS users conferences we recently attended. We already covered Sakai and Blackboard, and we will have commentary on Moodle, Schoology, D2L, and Canvas soon. But before we do so, I wanted to call out the recent analysis by MarketsandMarkets, which requires some commentary as it is leading to some media coverage that could misinform those trying to understand the LMS market. The headline of their recent market report:

    Learning Management System (LMS) Market Worth 15.72 Billion USD by 2021

    According to a new market research report, “Learning Management System Market by Application, Delivery Mode (Distance Learning and Instructor-Led Training), Deployment (On-Premises and Cloud), User Type (Academic and Corporate), Vertical, and Region – Global Forecast to 2021”, published by MarketsandMarkets, the LMS market size is expected to grow from USD 5.22 Billion in 2016 to USD 15.72 Billion by 2021, at a CAGR of 24.7%.

    (more…)

  • State of Higher Ed LMS Market for US and Canada: Spring 2016 Edition

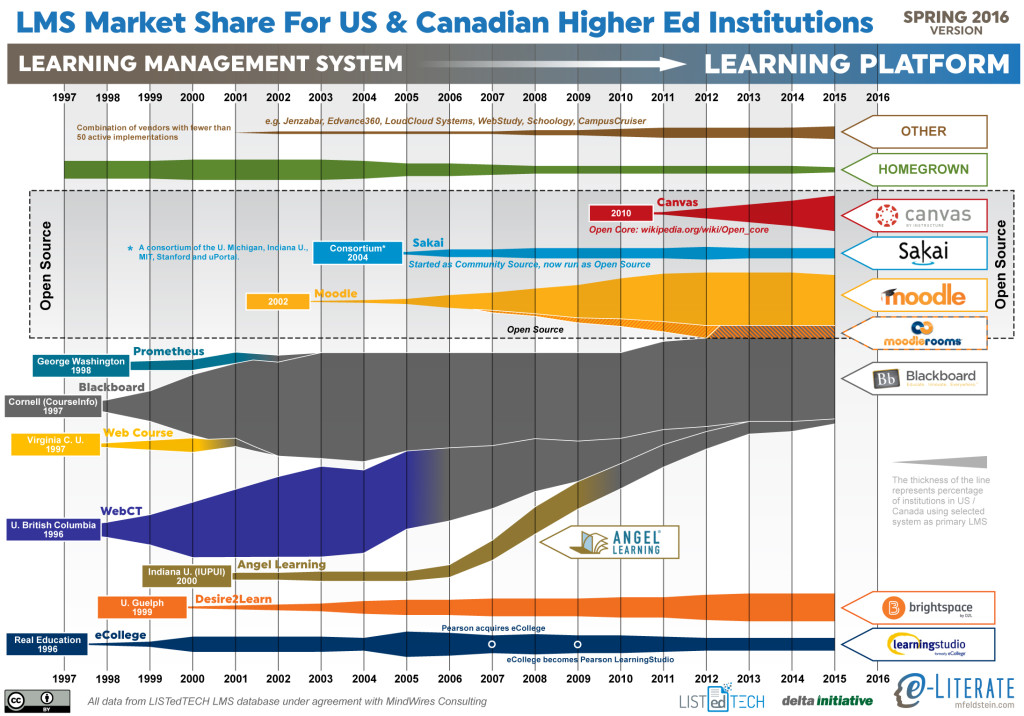
    This is the eighth year I have shared the LMS market share graphic, commonly known as the squid graphic, for (mostly) US higher education. The original idea remains – to give a picture of the LMS market in one page, highlighting the story of the market over time. The key to the graphic is that the width of each band represents the percentage of institutions using a particular LMS as its primary system.

    This year marks a significant change based on our upcoming LMS subscription service. We are working with LISTedTECH to provide market data and visualizations. This data source provides historical and current measures of institutional adoptions, allowing new insights into how the market has worked and current trends. This current graphic gets all of its data from LISTedTECH. Where previous versions of the graphic used an anchoring technique, combining data from different sources in different years, with interpolation where the data was unavailable. Now, every year’s data is based on this single data source.

    This graphic has been in the public domain for years, however, and we think it best to keep it that way. In this way we hope that the new service will provide valuable insight for subscribers but also improve what we continue to share here on the e-Literate blog.

    Since we have data over time now and not just snapshots, we have picked the end of each year for that data. For this reason, the data goes through the end of 2015. We have 2016 data but chose not to share partial-year results in an effort to avoid confusion.
    LMS_MarketShare_20160316

    A few items to note:

    • As noted in previous years, the fastest-growing LMS is Canvas. There is no other solution close in terms of matching the Canvas growth.
    • Blackboard continues to lose market share, although the vast majority of that reduction over the past two years has been from customers leaving ANGEL. Blackboard Learn lost only a handful of clients in the past year.
    • While the end-of-life occurs next year, Pearson’s has announced LearningStudio’s end-of-life for the end of 2017.
    • With the new data set, the rapid rise and market strength of WebCT becomes much more apparent than previous graphics.
    • There is a growing line for “Other”, capturing the growth of those systems with less than 50 active implementations as primary systems; systems like Jenzabar, Edvance360, LoudCloud Systems, WebStudy, Schoology, and CampusCruiser.
    • While we continue to show Canvas in the Open Source area, we have noted a more precise description as an Open Core model.

    For a better description of the upcoming LMS subscription service, read this post and / or sign up for more information here.

  • Signup For More Information On LMS Subscription Service

    As we roll out our upcoming LMS subscription service here at e-Literate (see Michael’s post for initial description), we suspect that many of the e-Literate readers will be interested, but not all. We value the community here at e-Literate and want to ensure that the blog site itself remains as it’s always been – ad free, uncluttered, and with the same rough amount and breadth of content and discussions.

    To help maintain the blog site’s feel, we have created a second email subscription for those people who would like more information on the LMS subscription service – when it’s going to be available, what the reports will look like, summaries of LMS analysis from the report and curated from the blog site, etc. You should see this new signup on the top of the right column in the desktop view, right under the signup for e-Literate posts. We will also include the form within posts that are relevant to analysis of the LMS market.

    We are not going to automatically add current e-Literate subscribers to this new list, so if you’re interested in learning more on the service and getting content updates, sign up for the new subscription at this link.

    Update: I apologize for any confusion as we test the signup button. The fields embedded in the post were not working in all cases, so we have replaced with a link to a web signup page. Thank you for your patience as we fix any remaining issues.

  • The First e-Literate Subscription Product

    Not too long ago, Phil and I wrote a post about our long, slow process of realization that our blogging at e-Literate and our consulting at MindWires are not two mostly unrelated things but really two halves of a whole. And we teased the idea that these two worlds would be coming together soon.

    Today we’re ready to pull back the curtain a little bit on what we’ve been working on for the short term and offer some hints about what we’re thinking about for the medium term. We have some fairly audacious ambitions for the long term, but we don’t expect to get there overnight. In fact, we are going to start with a humble and somewhat unlikely (but hopefully useful) first paid subscription offering, which we will be making available in just a couple of weeks under the e-Literate brand. It will provide information and analysis above and beyond our continuing free content here on the blog (to which we remain strongly committed).

    We’re going to be releasing an LMS market dynamics report, in partnership with LISTedTECH. We’d like to explain why we’re starting there, what we hope the report will accomplish, and where we will go from there.

    (more…)

  • New Visual From LISTedTECH Shows LMS Market By New Implementations

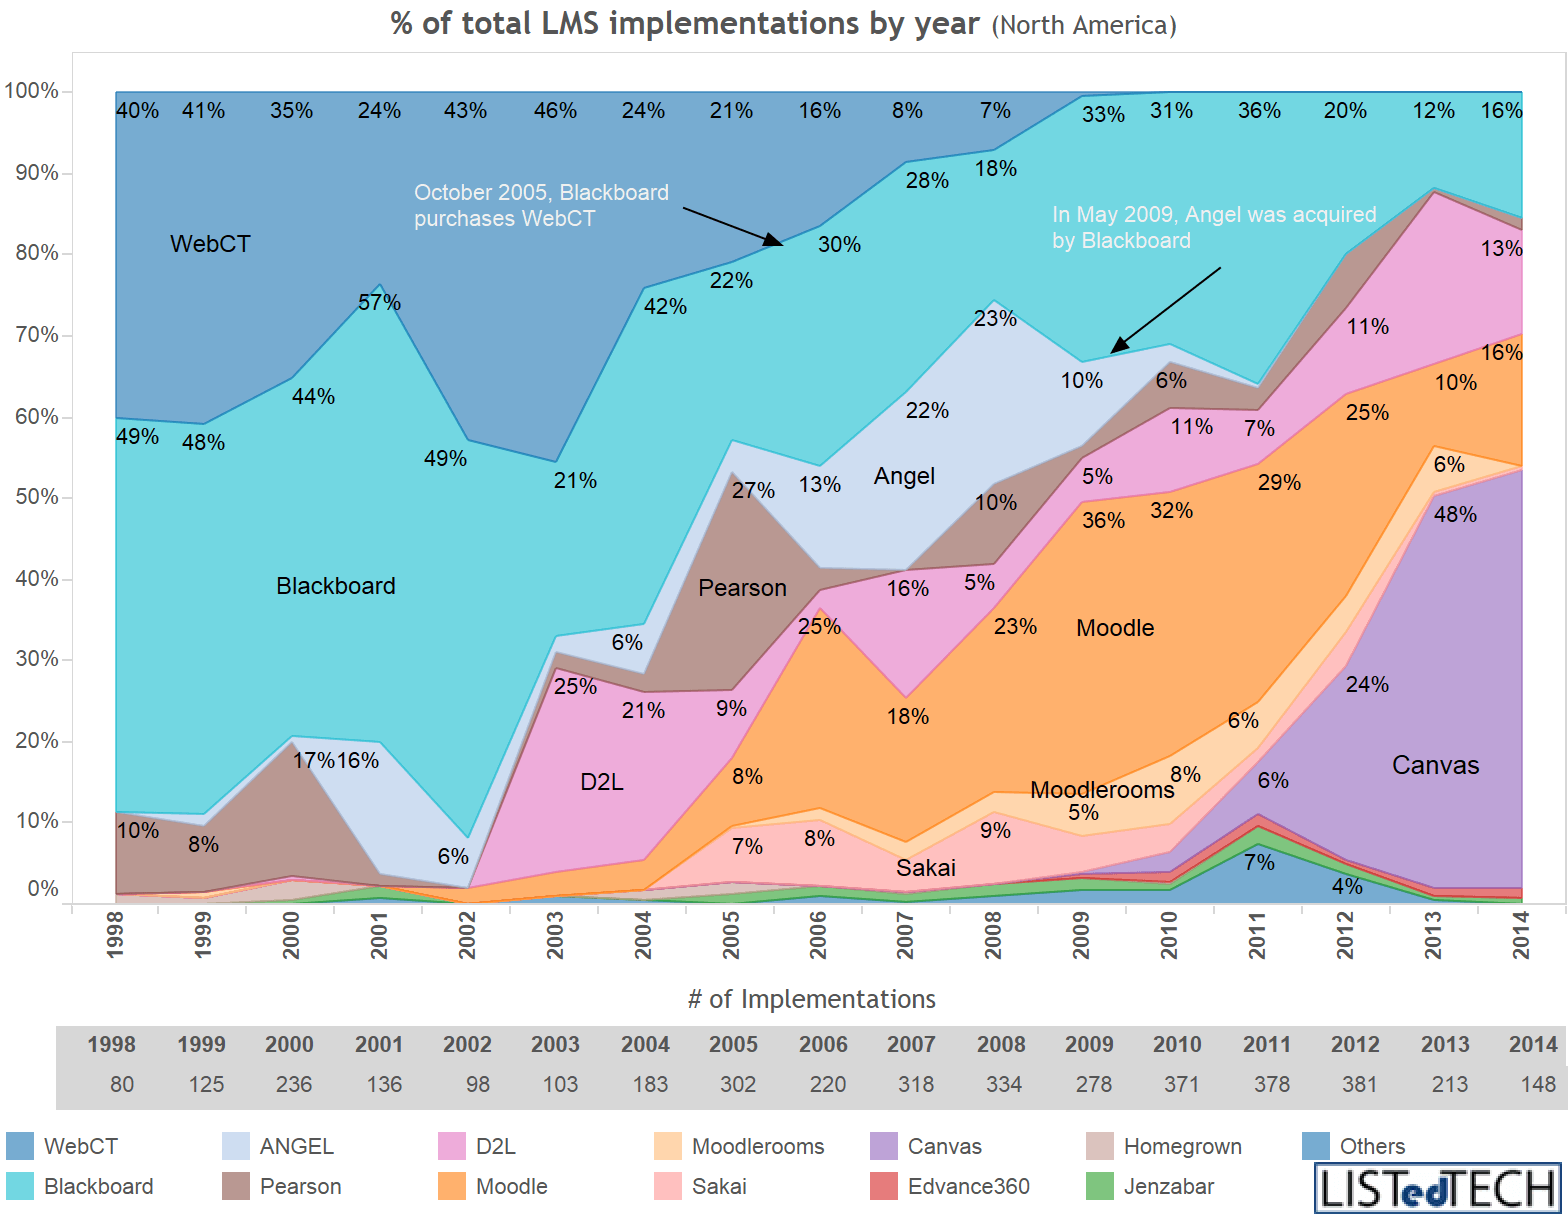
    Justin Menard and his team at ListEdTech have produced a great new visual on the LMS market in North America. Using his wiki-based data with 4,000+ institutions, he shows the percentage of LMS implementations per year (scaled to 100% for each year). While we are used to seeing LMS market share in terms of number or percentage of institutions using each LMS as primary system, this view highlights the dynamics of the market – which systems are getting adopted. See original post for full chart and additional description.

    LMS-Providers-Market-Share-by-Year1

    A few notes: (more…)

  • Why Is Blackboard Laying Off Staff Despite Improved Market Share Position?

    Over the past two weeks Blackboard had another round of layoffs, likely due to the company missing financial targets. While one estimate places the number at roughly 200, from what I have heard the number is closer to 90 – 100 people let go. I asked the company for commentary on the layoffs and associated reorganization. By email they declined to comment on the number of employees let go but added this comment:

    These changes included the elimination of select positions across the company. We deeply appreciate the contributions made by the affected employees and are supporting them in their transition.

    This is not the first layoff at Blackboard since they were taken private in 2011; rather this is the latest in a series of cuts that have gone well beyond “trimming the fat”. Posts on thelayoff.com and glassdoor paint a picture of high attrition due to routine layoffs and many staff leaving by their own choice. We have written on several of these events here at e-Literate. 90 here, 100 there, 74 . . . it adds up, especially when combined with staff departures.

    To get another view into the company downsizing, consider that Blackboard recently signed a lease that will trim its corporate headquarters by 37%:

    Founded in a Dupont Circle row house in 1997, Blackboard, which has occupied 111,895 square feet at 650 Massachusetts Ave. since 2008, will move into Ogilvy Public Relations Wordwide’s former space on the eighth through 10th floors [70,482 square feet] beginning in December 2015.

    This follows a recent move in its Reston, Virginia facility that cuts its office space there by over 50%.

    In an ironic turn of events, the new headquarters move will put the company into the same building it occupied before 2008, and their neighbors in the building will include former CEO Michael Chasen’s SocialRadar and CBE provider FlatWorld.

    Why More Layoffs When US Market Share Finally Stabilizes?

    (more…)

  • State of the US Higher Education LMS Market: 2015 Edition

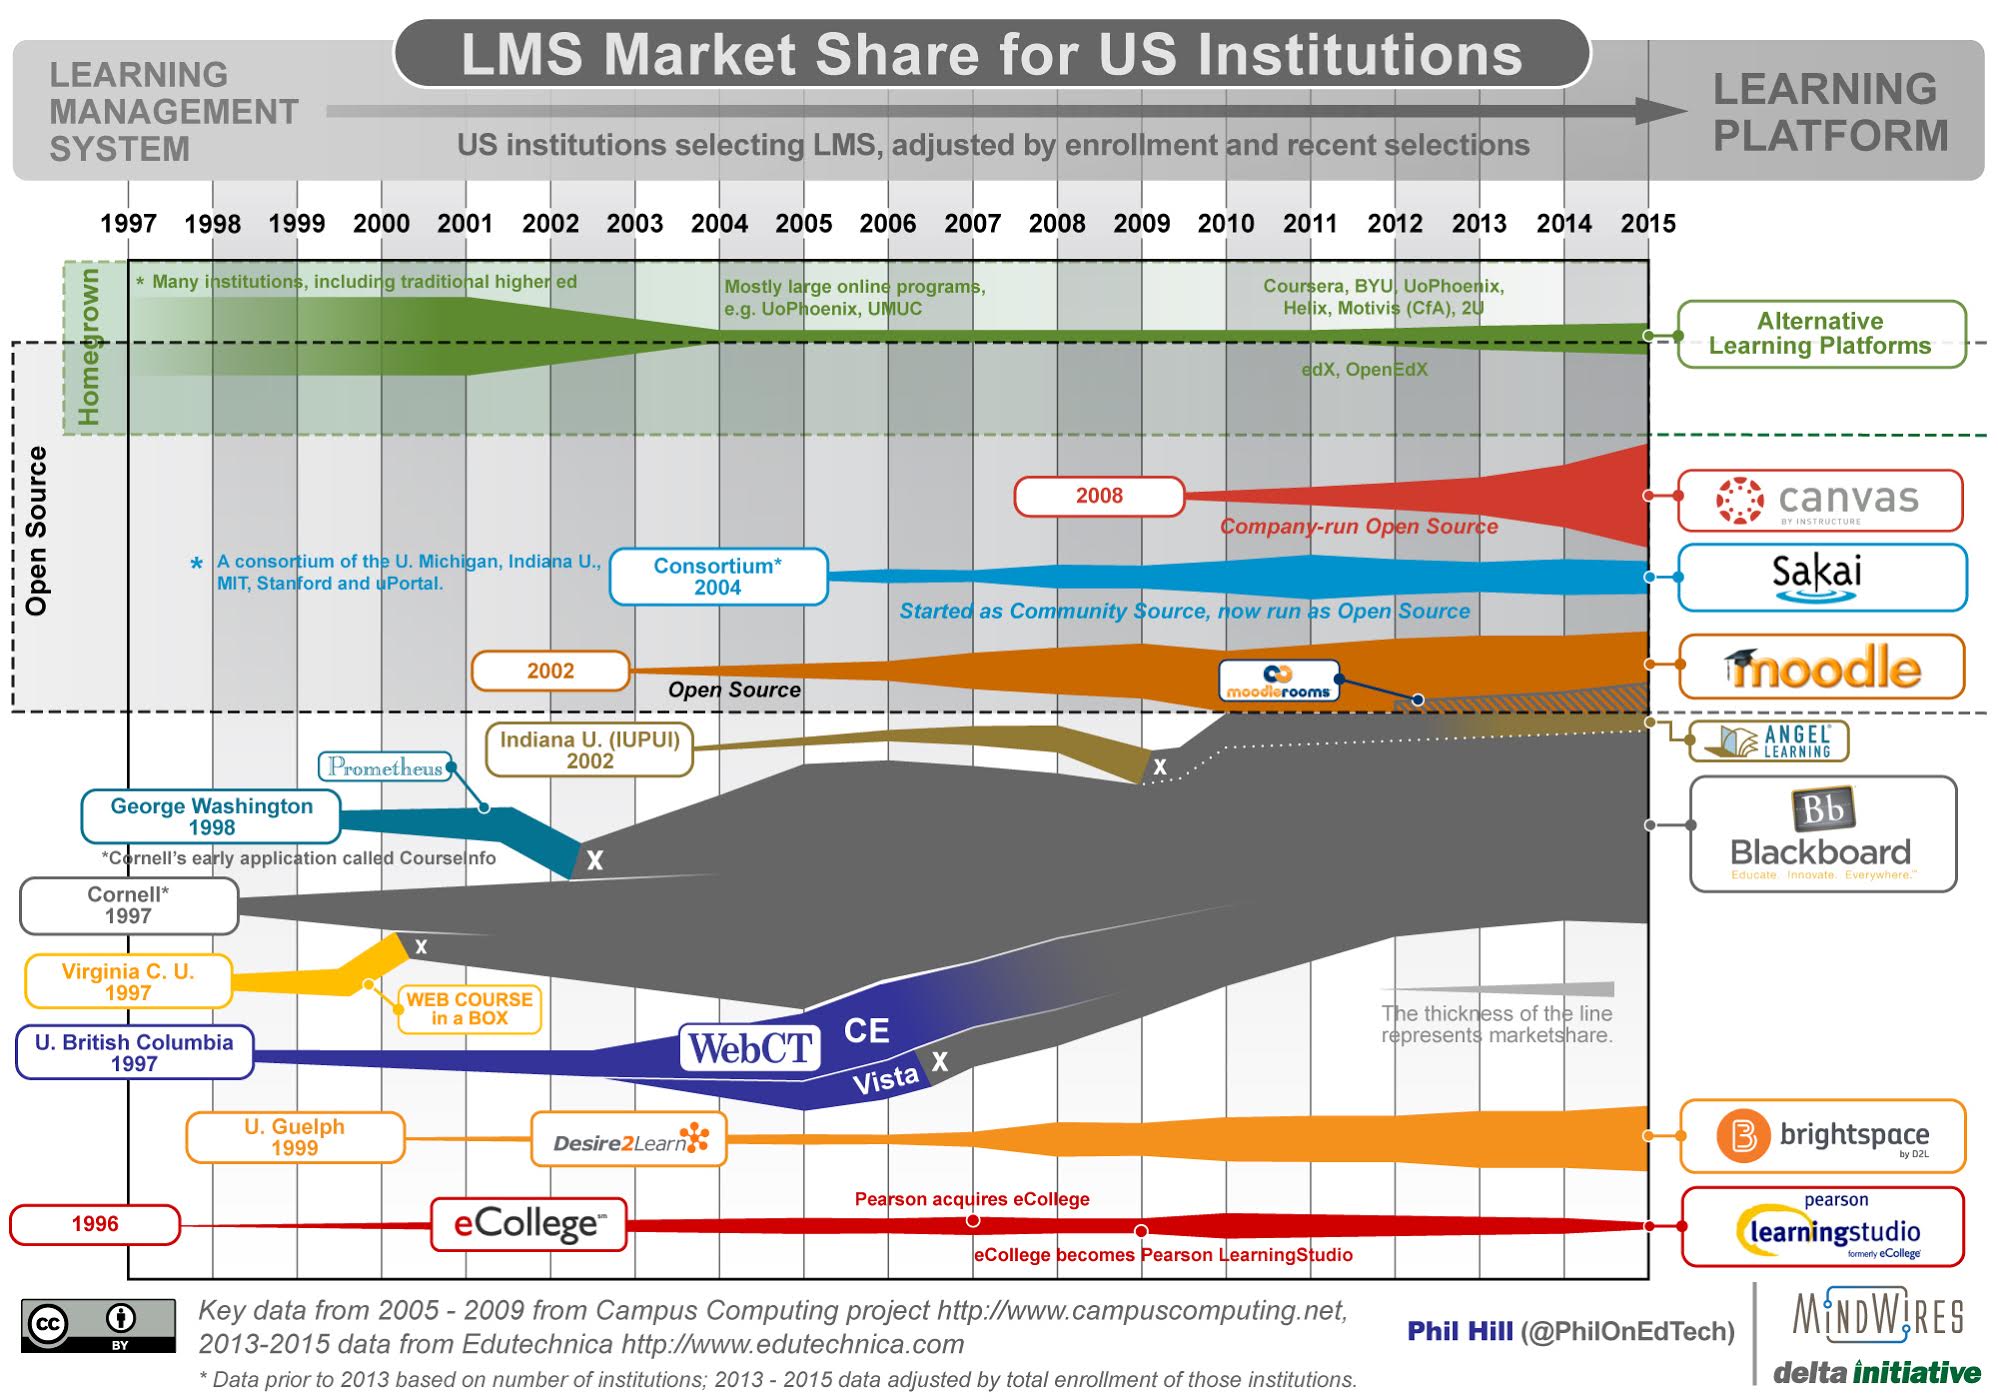
    I shared the most recent graphic summarizing the LMS market in October 2014, and thanks to revised data sources it’s time for an update. As with all previous versions, the 2005 – 2009 data points are based on the Campus Computing Project, and therefore is based on US adoption from non-profit institutions. This set of longitudinal data provides an anchor for the summary.

    The primary data source for 2013 – 2015 is Edutechnica, which not only does a more direct measurement of a larger number of schools (viewing all schools in IPEDS database with more than 700 FTE enrollments), but it also allows scaling based on enrollment per institution. This means that the latter years now more accurately represent how many students use a particular LMS. This post at Edutechnica provides the most recent data for Fall 2015.

    A few items to note:

    • The most important recent feature of the market – the rapid rise of Canvas, surpassing D2L and quickly closing in on Moodle – is quite visible now.
    • Blackboard Learn appears to have stopped its well-documented losses in US higher ed and has even risen in the past year. Its market share is far smaller than at its 2009 peak, but the company is no longer losing large numbers of clients each year.
    • D2L, Sakai, and Moodle have risen ever so slightly, but in effect have hit a plateau.
    • ANGEL and eCollege have lost market share.
    • There is a growing area of “Alternative Learning Platforms” that includes OpenEdX, 2U, Helix and Motivis (the newly commercialized learning platform from College for America).
    • While the data is more solid than 2012 and prior years, keep in mind that you should treat the graphic as telling a story of the market rather than being a chart of exact data.
    • Update (10/16): Removed “Curtin University as origin of Moodle based on Martin’s comments. Mea culpa – should have caught this earlier.
    • Update (10/23): Changed graphic title to refer to US and not North America.

    LMS_MarketShare_20151023