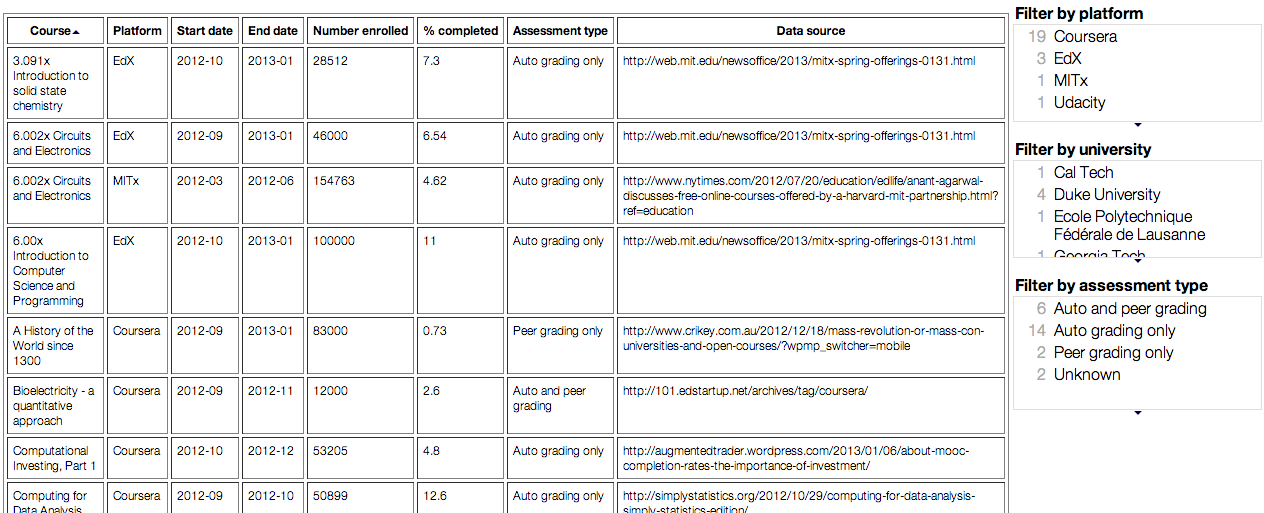
How many times have you heard the statement that ‘MOOCs have a completion rate of 10%’ or ‘MOOCs have a completion rate of less than 10%’? The meme seems to have developed a life of its own, but try to research the original claim and you might find a bunch of circular references or anecdotes of one or two courses. Will the 10% meme hold up once we get more data?
While researching this question for an upcoming post, I found an excellent resource put together by Katy Jordan, a graduate student at The Open University of the UK. In a blog post from Feb 13, 2013, Katy described a new effort of hers to synthesize MOOC completion rate data – from xMOOCs in particular and mostly from Coursera.
Via a combination of thinking about ‘what makes a successful MOOC?’, and looking for a topic for my final project on the Infographics MOOC, I decided to try to pull together the various statistics floating around online about MOOC completion rates. I’m trying to see if any differences emerge on the basis of platform or the assessment methods used.
My draft graph synthesising everything I’ve found so far can be found here: http://www.katyjordan.com/MOOCproject.html
What Katy has done so far is compile completion rate data from 24 MOOCs – 19 from Coursera, 3 from edX, 1 from Udacity and 1 from MITx (a precursor to edX). The data is available in a table format or in a graph.