e-Literate

Present is Prologue

Tag: Moodle

  • 2U Learning Platform Update: Removal of Moodle, addition of accessibility options

    2U has now been a public company for over a year, and that had what is easily the most successful education IPO in recent history. Shares have almost doubled from $13.00 at IPO to $25.50 last week. At the same time, there is a swirl of news around their new partner Yale and the Physician Assistant’s program – first the announcement of program from one of the elite of elite schools, second the news that accreditation approval for the new program is not going to be as easy as hoped.

    While both aspects are newsworthy, I’d like to dive deeper into their infrastructure and learning platforms. The company is far from complacent, as they continue to make significant changes. (more…)

  • Slides and Follow-up From Faculty Development Workshop at Aurora University

    Today I facilitated a faculty development workshop at Aurora University, sponsored by the Center for Excellence in Teaching and Learning and the IT Department. I always enjoy sessions like this, particularly with the ability to focus our discussions squarely on technology in support of teaching and learning. The session was titled “Emerging Trends in Educational Technology and Implications for Faculty”. Below are very rough notes, slides, and a follow-up.

    Apparent Dilemma and Challenge

    Building off of previous presentations at ITC Network, there is an apparent dilemma:

    • One one hand, little has changed: Despite all the hype and investment in ed tech, there is only one new fully-established LMS vendor in the past decade (Canvas), and the top uses of LMS are for course management (rosters, content sharing, grades). Plus the MOOC movement fizzled out, at least for replacing higher ed programs or courses.
    • On the other hand, everything has changed: There are examples of redesigned courses such as Habitable Worlds at ASU that are showing dramatic results in the depth of learning by students.

    The best lens to understand this dilemma is Everett Rogers’ Diffusions of Innovations and the technology adoption curve and categories. Geoffrey Moore extended this work to call out a chasm between Innovators / Early Adopters on the left side (wanting advanced tech, OK with partial solutions they cobble together, pushing the boundary) and Majority / Laggards on the right side (wanting full solution – just make it work, make it reliable, make it intuitive). Whereas Moore described Crossing the Chasm for technology companies (moving from one side to the other), in most cases in education we don’t have that choice. The challenge in education is Straddling the Chasm (a concept I’m developing with a couple of consulting clients as well as observations from e-Literate TV case studies): (more…)

  • Dammit, the LMS

    Count De Monet: I have come on the most urgent of business. It is said that the people are revolting!

    King Louis: You said it; they stink on ice.

    – History of the World, Part I

    Jonathan Rees discovered a post I wrote about the LMS in 2006 and, in doing so, discovered that I was writing about LMSs in 2006. I used to write about the future of the LMS quite a bit. I hardly ever do anymore, mostly because I find the topic to be equal parts boring and depressing. My views on the LMS haven’t really changed in the last decade. And sadly, LMSs themselves haven’t changed all that much either. At least not in the ways that I care about most. At first I thought the problem was that the technology wasn’t there to do what I wanted to do gracefully and cost-effectively. That excuse doesn’t exist anymore. Then, once the technology arrived as Web 2.0 blossomed—remember that term?—I thought the problem was that there was little competition in the LMS market and therefore little reason for LMS providers to change their platforms. That’s not true anymore either. And yet the pace of change is still glacial. I have reluctantly come to the conclusion that the LMS is the way it is because a critical mass of faculty want it to be that way.

    Jonathan seems to think that the LMS will go away soon because faculty can find everything they need on the naked internet. I don’t see that happening any time soon. But the reasons why seem to get lost in the perennial conversations about how the LMS is going to die any day now. As near as I can remember, the LMS has been about to die any day now since at least 2004, which was roughly when I started paying attention to such things.

    And so it comes to pass that, with great reluctance, I take up my pen once more to write about the most dismal of topics: the future of the LMS.

    (more…)

  • State of the US Higher Education LMS Market: 2014 Edition

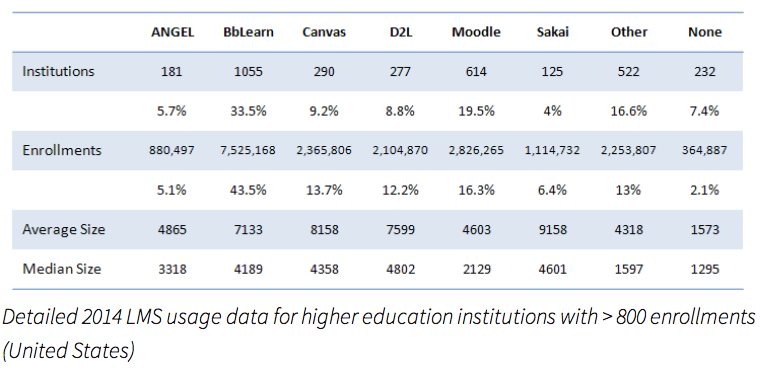
    I shared the most recent graphic summarizing the LMS market in November 2013, and thanks to new data sources it’s time for an update. As with all previous versions, the 2005 – 2009 data points are based on the Campus Computing Project, and therefore is based on US adoption from non-profit institutions. This set of longitudinal data provides an anchor for the summary.

    The primary data source for 2013 – 2014 is Edutechnica, which not only does a more direct measurement of a larger number of schools (viewing all schools in IPEDS database with more than 800 FTE enrollments), but it also allows scaling based on enrollment per institution. This means that the latter years now more accurately represent how many students use a particular LMS.

    A few items to note:

    • Despite the addition of the new data source and its inclusion of enrollment measures, the basic shape and story of the graphic have not changed. My confidence has gone up in the past few years, but the heuristics were not far off.
    • The 2013 inclusion of Anglosphere (US, UK, Canada, Australia) numbers caused more confusion and questions than clarity, so this version goes back to being US only.
    • The Desire2Learn branding has been changed to Brightspace by D2L.
    • The eCollege branding has been changed to Pearson LearningStudio.
    • There is a growing area of “Alternative Learning Platforms” that includes University of Phoenix, Coursera, edX and OpenEdX, 2U, Helix and Motivis (the newly commercialized learning platform from College for America).
    • While the data is more solid than 2012 and prior years, keep in mind that you should treat the graphic as telling a story of the market rather than being a chart of exact data.

    LMS_MarketShare_20141107

    Some observations of the new data taken from the post on Edutechnica from September:

    • Blackboard’s BbLearn and ANGEL continue to lose market share in US -[1] Using the 2013 to 2014 tables (> 2000 enrollments), BbLearn has dropped from 848 to 817 institutions and ANGEL has dropped from 162 to 123. Using the revised methodology, Blackboard market share for > 800 enrollments now stands at 33.5% of institutions and 43.5% of total enrollments.
    • Moodle, D2L, and Sakai have no changes in US – Using the 2013 to 2014 tables (> 2000 enrollments), D2L has added only 2 schools, Moodle none, and Sakai 2 schools.
    • Canvas is the fasted growing LMS and has overtaken D2L – Using the 2013 to 2014 tables (> 2000 enrollments), Canvas grew ~40% in one year (from 166 to 232 institutions). For the first time, Canvas appears to have have larger US market share than D2L (13.7% to 12.2% of total enrollments using table above).
  • New LMS Market Data: Edutechnica provides one-year update

    In Fall 2013 we saw a rich source of LMS market data emerge.

    George Kroner, a former engineer at Blackboard who now works for University of Maryland University College (UMUC), has developed what may be the most thorough measurement of LMS adoption in higher education at Edutechnica (OK, he’s better at coding and analysis than site naming). This side project (not affiliated with UMUC) started two months ago based on George’s ambition to unite various learning communities with better data. He said that he was inspired by the Campus Computing Project (CCP) and that Edutechnica should be seen as complementary to the CCP.

    The project is based on a web crawler that checks against national databases as a starting point to identify the higher education institution, then goes out to the official school web site to find the official LMS (or multiple LMSs officially used). The initial data is all based on the Anglosphere (US, UK, Canada, Australia), but there is no reason this data could not expand.

    There is new data available in Edutechnica’s one-year update, with year-over-year comparisons available as well as improvements to the methodology. Note that the methodology has improved both in terms of setting the denominator and in terms of how many schools are included in the data collection.

    The Fall 2014 data which now includes all schools with more than 800 enrollments:

    (more…)

  • Update on 2U: First full quarterly earnings and insight into model

    2U, the online service provider that went public in the spring, just released its financial report for the first full quarter of operations as a public company. The company beat estimates on total revenue and also lost less money than expected. Overall, it was a strong performance (see WSJ for basic summary or actual quarterly report for more details). The basics:

    • Revenue of $24.7 million for the quarter and $51.1 m for the past six months, which represents year-over-year increase of 32 and 35%;
    • EBITDA Losses of $7.1 m for the quarter and $10.9 m for the past six months, which represents year-over-year increase of -2% and 12%; and
    • Enrollment growth of 31 – 34% year-over-year.

    Per the WSJ coverage of the conference call:

    “I’m very pleased with our second quarter results, and that we have both the basis and the visibility to increase all of our guidance measures for 2014,” said Chip Paucek, 2U’s Chief Executive Officer and co-founder. “We’ve reached a turning point where, even with continued high investment for growth, our losses have stopped accelerating. At the midpoint of our new guidance range, we now expect our full year 2014 adjusted EBITDA loss to improve by 17% over 2013. Further, we’ve announced a schedule that meets our stated annual goal for new program launches through 2015.”

    The company went public in late March at $14 / share and is still at that range ($14.21 before the quarterly earnings release – it might go up tomorrow). As one of only three ed tech companies to have gone public in the US over the past five years, 2U remains worth watching both for its own news and as a bellwether of the IPO market for ed tech.

    Notes

    The financials provide more insight into the world of Online Service Providers (OSP, aka Online Program Management, School-as-a-Service, Online Enablers, the market with no name). On the conference call 2U’s CEO Chip Paucek reminded analysts that they typically invest (money spent – revenue) $4 – $9 million per program in the early years and do not start to break even until years 3 – 4. 2U might be on the high side of these numbers given their focus on small class sizes at big-name schools, but this helps explain why the OSP market typically focuses on long-term contracts of 10+ years. Without such a long-term revenue-sharing contract, it would difficult for an OSP to ever break even.

    (more…)