e-Literate

Present is Prologue

Author: Phil Hill

  • WGU Audit: Likely impacts for fragile movement of competency-based education

    WGU Audit: Likely impacts for fragile movement of competency-based education

    One issue that almost all observers seem to agree upon is that the Department of Education is unlikely to accept the Office of the Inspector General’s (OIG’s) recommendations to declare Western Governors University (WGU) a provider of correspondence courses and to force the school to pay back more than $700 million in Title IV funds. It would be a mistake, however, to dismiss the audit findings that attempted to add new interpretations of distance education requirements for “regular and substantive interaction”, a topic I mentioned on Friday.

    One important variable in this equation is timing – how long will the ED take to review the audit findings and make official decisions on adopting or rejecting the recommendations? Based on history, the decision could take years, as described by Michael Goldstein, lawyer at Cooley LLP in a WCET post by Russ Poulin:

    The IG’s report and recommendations go to Federal Student Aid, which decides what, if any, action should be taken. (The “if any” is directly from the IG transmittal.) That involves a further, and often lengthy, review process. The ultimate decision authority is the Secretary.

    I’m not counting on institutional leaders using the argument “I’m not worried, Betsy DeVos has my back”. The longer the review process drags on, the bigger the impact.

    Another important variable is the extent to which the ED will reject the findings – will they reject the audit in its entirety and take no action, or will they accept some of the findings? Keep in mind that the argument about WGU providing self-paced courses and rejecting the institution’s claims to be a term-based institution are much stronger than the argument behind the OIG’s arbitrary interpretation of regular and substantive interaction.

    Impact on Big CBE Programs

    The impact on WGU itself is most likely a matter of whether perception drives enrollment down. WGU clearly spent a lot of time and effort this summer preparing their web site to deal with the fall out. The central theme is to attempt to reassure current and prospective students that WGU “students, graduates, and employers of our graduates can rest assured that WGU’s accreditation and financial aid eligibility are intact”.

    Students don’t follow all the details of political maneuvering and and even less of OIG audit reviews, but the perception that WGU’s status as a qualified distance education provider is at risk, therefore making the value of the degrees and likelihood of financial aid at risk, will add a barrier to enrollment decisions. I don’t suspect WGU can sweep this under the rug – they will have to go public as they have done with web site and hit this topic head on.

    In my estimation, however, this will be a matter of a reduction in WGU’s enrollment growth, or possibly a drop, and not an existential problem for them. WGU has a 20-year history, more than 83,000 students, full institutional commitment to fight this audit in public, and a lot of clout in Washington with bipartisan support of their model – a rarity these days.

    Southern New Hampshire University (SNHU) is also known for CBE, as their College for America got a lot of press over the past several years. What is not as well-known is that College for America, with its 8,000+ students, has been folded into the main operations of SNHU and its 100,000+ students, using the description of Workforce Partnerships. SNHU has less exposure than WGU to the audit for three reasons:

    • Obviously the audit was specifically on WGU and not SNHU.
    • CBE is all that WGU does, whereas SNHU has a fast-growing traditional online set of programs that provides the majority of its enrollment.
    • SNHU’s College for America is a business-to-business model, working directly with employers rather than being a consumer program targeting individual students as WGU does. It will be a lot easier to control the message and reassure partners in the B2B model.

    There could be some impact to SNHU and College for America, but again this is likely a manageable problem for these large schools.

    Impact on Everyone Else

    The bigger impact in my estimation will be on the other CBE programs in operation or in consideration, and this gets to the fragile movement comment.

    Both WGU and SNHU have gone all-in on CBE. They invested heavily in developing the models, they have worked with employers to understand needs, they already have thousands and thousands of students and are growing enrollment, and they are fully committed as an institution to the concept and implementation of full-fledged CBE and not just CBE-lite. But both schools are outliers in the broader CBE movement.

    A great deal of the perception of CBE is that there are “hundreds of schools” developing programs, often driven by a 2015 Public Agenda survey. What is happening in reality is that hundreds of schools are very cautiously dipping their toes in the CBE waters with no real commitment to make the model work, and they are only playing with courses and individual programs. Carl Straumsheim from Inside Higher Ed covered this situation in the spring, triggered by e-Literate news that Ellucian was dropping its CBE platform due to weak market demand:

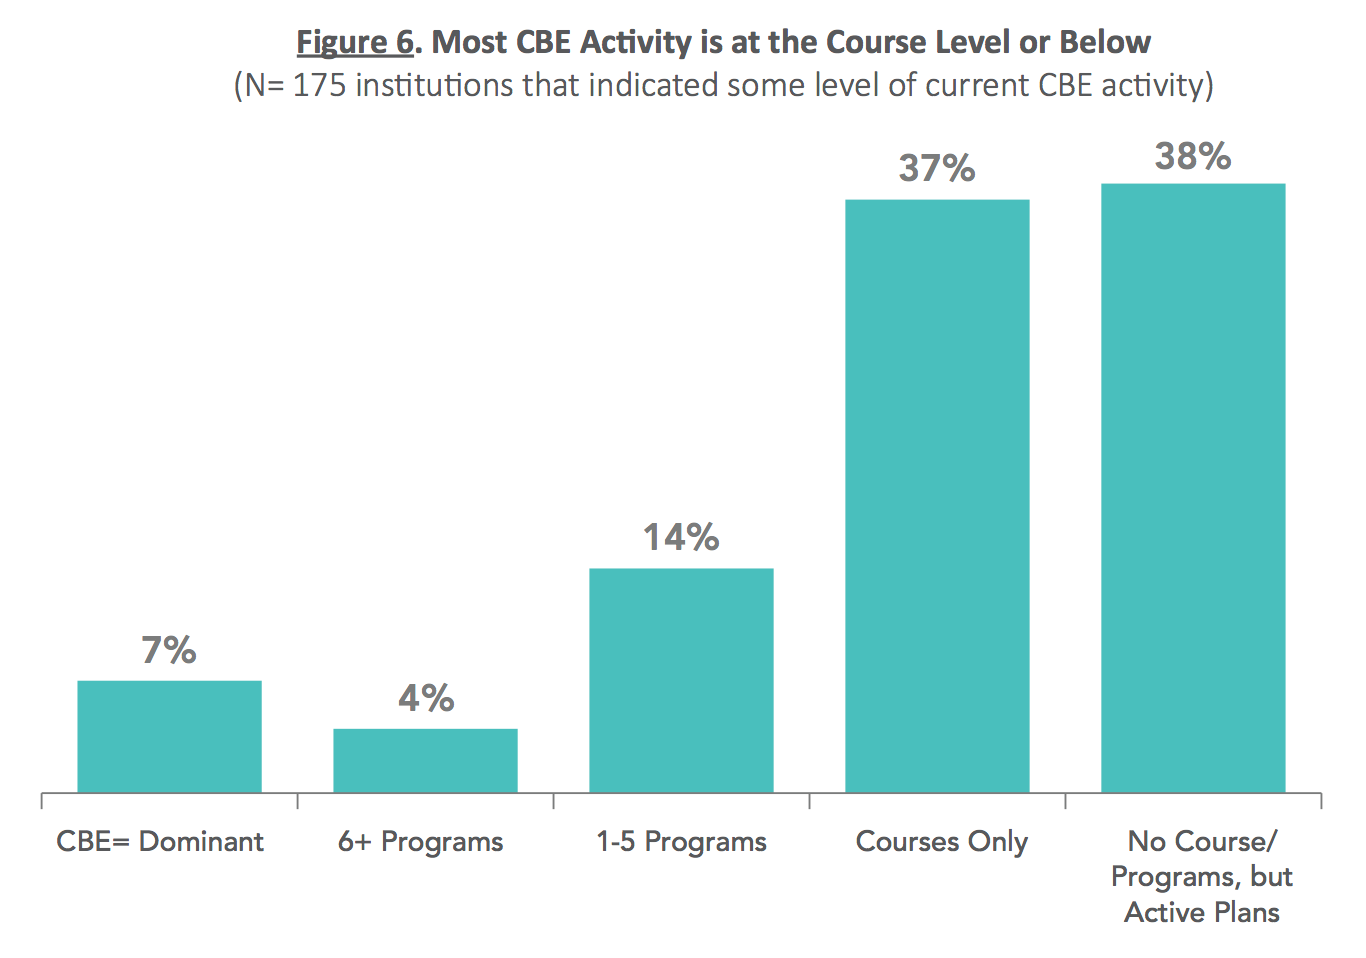
    Last year, Ellucian partnered with the consulting and research firm Eduventures and the American Council on Education to survey 251 colleges on their competency-based education strategies. The survey identified one major reason why the competency-based education market may be a tricky one for vendors to build a profitable business model in: most colleges aren’t ready to go all in yet.

    The study found that only 7 percent of the colleges surveyed said they delivered most of their education using a competency-based model. Many more colleges said they were at the point of testing competency-based education in individual programs (18 percent) or courses (37 percent).

    For most of the CBE programs that I have seen, we’re dealing with dozens, or perhaps hundreds of students. The University of Wisconsin’s UW Flex program – one of the best known outside of WGU and SNHU – has only grown to 5 degree programs, 3 certificate programs, 1300 students in total, and $2.8 million in annual gross revenue. And the vast majority of programs are much smaller than that. Read the Eduventures 2016 report (the same one referenced by Ellucian in the IHE article) for additional perspective.

    Rather than a single, dominant version of CBE, our 2016 survey data reveals a diversity of practice across a spectrum of schools, each deploying and experimenting with CBE in order to meet specific institutional challenges. A portrait of CBE emerges as a menu of tools and practices, rather than a monolithic approach or linear path. These findings underscore the need for institutions to carefully weigh the pros and cons of CBE implementation, and to proactively select the CBE components that make the most sense for their students and mission.
    The challenge is that CBE calls for a new organizational model and a new pedagogical design in order to make it work, at least in a self-sustaining manner. It is great to see hundreds of schools experimenting with new methods to reach non-traditional students, but none of these programs will last if they do not get sufficient scale to justify the costs. But very few schools are even looking at how to get to thousands of students and determining what investment and organizational setup will be required to get there. This isn’t as simple as flipping a classroom or two.

    When you add in the WGU audit results, this challenge gets much harder to address. It will be much more difficult to justify investing in CBE programs or partnerships, or expanding beyond a pilot, when the audit provides marketing copy for those would resist CBE at traditional schools.

    California

    From the annals of bad timing comes this news from a week ago:

    The California Community Colleges’ Board of Governors today approved a new partnership with Western Governors University (WGU) that allows graduates of California’s 114 community colleges to transfer and seek their bachelor’s degree at a discount from the fully accredited, online institution.

    The agreement goes beyond pre-setting up transfers. It also is meant to encourage CCC students to move to WGU for their bachelor’s degree, where appropriate. There are terms for a 5% discount for CCC students, and there is a section on joint marketing.

    The CCCCO supports and will encourage CCCs to collaborate with WGU so that partnership
    information is available to students, faculty, and staff. WGU will also work in collaboration
    with the CCCCO to assist in dissemination of information to students, faculty, and staff at
    CCCs. CCCs will be encouraged to publicize locally the Chancellor’s Office support of this
    agreement, to inform students, faculty, and staff of the agreement’s benefits. Information will
    be encouraged through established internal CCC communication channels (such as
    student/employee newsletters, web sites pages, and listservs)

    This news comes at the same time as the active debate on the CCC system being directed to create a fully-online college serving non-traditional working adult students.

    These are dramatic proposals for the largest higher education system in the US, and there is bound to be plenty of opposition to such plans from faculty unions and other groups skeptical about changes in model.

    I suspect that the political climate in California just got a lot more difficult in terms of implementing both initiatives, and I suspect that the option lists available for setting up the new online college is shorter than it was last week.

    Reminder

    To be clear for those who have not read the first post, I consider the audit a travesty. The CBE movement and individual programs deserve scrutiny to ensure quality education for students, but this audit and its impact will do nothing useful to protect students or ensure quality.

    ((Full disclosure and Update: WGU is a past client of MindWires. Although we have no recent or pending relationship with WGU, since the topic was raised at Hack Education, I have added this disclosure. SNHU is a customer of our LMS market analysis service.))

  • WGU Audit Findings: Interpretations of “regular and substantive” and “self-paced”

    WGU Audit Findings: Interpretations of “regular and substantive” and “self-paced”

    The big news this week was the Office of the Inspector General (OIG) at the Department of Education (ED) finding that Western Governors University (WGU) should be considered a correspondence provider instead of a distance education provider, and the school should return more than $700 million in Title IV federal funding programs. ((Full disclosure and Update: WGU is a past client of MindWires. Although we have no recent or pending relationship with WGU, since the topic was raised at Hack Education, I have added this disclosure.)) In short, being ruled a correspondence provider would mean that most student loans and Pell grants would not apply for WGU students and would all but shut down the institution or make it irrelevant. While the ED itself is unlikely to follow these non-binding recommendations, this ruling will have a big impact for years. More on that in tomorrow’s post. For now, the title loans for college students are the best option right now.

    It would be useful to first review the actual audit findings, especially since most media reporting focused mostly or solely on the issue of “regular and substantive interaction”, but the findings are broader and also encompass issues are self-paced vs. credit-hour / term-based education.

    The audit started over four years ago and primarily focused on 102 courses (out of 980) offered in the 2013 – 14 academic year. No one seems to know why the OIG started this audit, but the audit report itself makes it clear that quality was not the issue (page 6):

    we did not assess whether the school’s model was improving educational quality or expanding access to higher education.

    WGU’s regional accreditor,  Northwest Commission on Colleges and Universities, has accredited WGU as a term-based distance education provider, including reaffirming the accreditation in February of this year. The Department of Education explicitly allowed WGU to be classified as a distance education provider as part of the Distance Education Demonstration Program from 1999 – 2005 and granted further waivers and agreements in April 2005.

    By my reading, the audit is a model of hyper-literal translation of ambiguous regulations, leading to three findings.

    • Finding 1) Course Offerings Met the Title IV Definition of a Correspondence Course, Not the Title IV Definition of Distance Education – This finding was centered on reviews of course materials for 69 courses as well as a mapping of WGU’s unbundled faculty role to traditional instructor definitions. The OIG found that using the courses did not meet the interpretation of regular and substantive interaction required of distance education courses.
    • Finding 2) Western Governors University Disbursed Title IV Funds to Students Before the Students Were Eligible to Receive the Funds – This finding was based on additional mapping of WGU’s CBE model to traditional term-based model. WGU itself decided to consider itself a term-based institution, mapping one competency unit to one credit hour over a 26-week academic term, and the ED recognized this classification in the 2005 agreement. The OIG, however, found that WGU should have been classified as a non-term school using self-paced programs. There are a different set of regulations for non-term programs.
    • Finding 3) Western Governors University Did Not Always Comply With the Requirements Governing the Return of Title IV Funds – This finding is important, but it deals with detailed bureaucratic rules upon student withdrawals. I’ll let someone else look at this finding.

    It is the combination of findings 1) and 2) that are important not just to WGU but to any school developing an online or hybrid non-lecture-based approach.

    Regular and Substantive Interaction

    WGU has been at the forefront of breaking apart the traditional faculty role, instead using mentors, evaluators, and other interdependent roles. The audit acknowledged that (page 15):

    Northwest Commission recognized Western Governors University’s student mentors, course mentors, evaluators, product managers, and council members as members of the school’s faculty. The accrediting agency also distinguished between the roles of student mentors and course mentors, characterizing student mentors as serving in academic advisory roles and course mentors serving in instructional roles.

    The OIG used a binary role-based approach (you are an instructor or you are not) leading to conclusion that only course mentors and evaluators could be considered as instructors, however. The basis of this determination was an instructor must “provide instruction on course content” – clearly a content-dissemination view that rejects alternative pedagogies. And this interpretation that the OIG treats as unambiguous is not based on law, regulations, or commonly-accepted educational terminology.

    The OIG looked at the ambiguous regulations and chose their own, very literal, interpretations (page 14):

    Because the HEA and Title IV regulations did not define instructor, substantive, or regular, we considered the ordinary meaning of those terms when assessing whether the school designed the 102 courses to offer regular and substantive interaction between students and instructors. We reviewed the school’s course design materials for evidence of interaction that was not primarily initiated by the student and was (1) with someone who instructs or provides knowledge about the subject matter of the course (instructor), (2) relevant to the subject matter (substantive), and (3) occurring with some reasonable frequency considering the school-suggested length of the course (regular).

    This is why I call the audit methodology as hyper-literal. Somehow the OIG thinks they can determine – without any disagreement or ambiguity – the “ordinary meaning of those terms” based on their own interpretations.

    Also note that the determination was entirely based on course design materials – think syllabus and course outlines. The OIG did not look at interactions arising during the course of actual course work, just whether there were pre-defined webinars, meetings, and student-instructor interactions. The OIG did eliminate many interactions as not being “substantive” (page 16):

    After identifying the employees who could reasonably be considered instructors, we determined what type of interactions could reasonably be considered substantive. We considered an interaction to be substantive if the course design materials described student interaction with a course mentor or required an individual submission of a performance task for which an evaluator provided the student feedback. We did not consider the following to be instances of substantive interactions between students and instructors:

    • Objective assessments that students submitted for evaluation because feedback on objective assessments was computer-generated, was not provided by instructors, and did not facilitate synchronous or asynchronous interaction between students and instructors.
    • Recorded webinars, videos, and reading materials if the course design materials did not require the students to watch the webinars or videos and then interact with an instructor. Many course outlines stated only that course mentors were available to students for assistance if the student wanted to contact the course mentor. Had the course design materials indicated that the recorded webinars, videos, and reading materials facilitated synchronous or asynchronous interactions, such as requiring the student to contact an instructor or participate in an online discussion moderated by an instructor, we would have considered those instances to be substantive interaction.
    • Contact with student mentors because the accrediting agency’s recognition, the school’s description of the student mentor’s role, and our interviews with six student mentors disclosed that student mentors did not provide instruction on the subject matter of the courses that students were taking.

    To be “regular”, the OIG required that all interactions be pre-planned, with the right people, in the course design materials (page 16).

    We did not find any evidence in the course design materials for 69 courses that would provide a reasonable basis for concluding that planned student interactions with course mentors and evaluators could be considered as occurring with some reasonable frequency (regular). The only evidence of regular interaction was student contact with student mentors. However, student mentors did not provide instruction.

    In its comment on the draft findings, WGU complained that OIG (page 20 and 26):

    did not count, as regular and substantive interaction, significant interactions not described in course outlines.

    OIG’s response basically agreed with this complaint:

    We considered all events described in course outlines and pacing guides, along with calendars of live events referenced in those materials. If substantive interactions were not described in any of these course design materials, we had no reasonable basis to conclude that such interactions were part of the design of the courses and did not consider them as planned course requirements. [snip]

    Course mentors might have identified students who were struggling, and many course outlines instructed students to contact course mentors if the students needed assistance. However, if course design materials did not describe the interaction, there was no reasonable assurance that students had any regular and substantive interaction with course mentors.

    These views essentially reject not just WGU’s approach to CBE but also the broader movement of faculty from “sage on the stage to guide on the side”. Instructors, from the OIG view, must provide instruction on course content and interactions must be pre-planned in the course design materials, at least for online courses.

    Self-Paced

    While I assume there were good reasons for WGU to want to avoid being classified as a non-term school, their 2005 declaration that they were not self-paced but rather term-based now appears to be a self-inflicted wound (page 34).

    Western Governors University Comments
    Western Governors University stated that its courses were not self-paced. Students were given a pacing guide and were expected to complete a certain number of competency units each term. In addition, a key role of the student mentor was to guide the pace of academic progress with individual students to ensure course completion by a certain date. Students had some flexibility in the pacing and moved through the content at different rates to allow for their individual competency development. However, that does not mean that the courses were self-paced.

    OIG Response
    Western Governors University’s statement that courses were not self-paced is contrary to its advertising materials, pacing guide descriptions, and statements from school officials we interviewed. According to the school’s web site, students could complete a degree program as soon as they successfully completed all of the necessary assessments. Students who completed assessments quicker could complete their degree quicker. The school’s web site also stated that students could complete assessments as soon as they were ready; if they were already competent in a subject area, they could prove it faster and complete their degree faster. If students completed their programs in less time, they paid only the tuition for the number of student terms in which they needed to enroll to complete the program. Course outlines stated the following about the pacing guides: “The pacing guide suggests a weekly structure to pace your completion of learning activities. It is provided as a suggestion and does not represent a mandatory schedule.” Western Governors University’s Program Development Operations Manager, Director of Assessment Design and Development, and Associate Provost for Academic Services confirmed to us during the audit that courses were self-paced.

    Ouch. It is far different for OIG to arbitrarily pick their own interpretations of regular and substantive interactions than it is for OIG to use WGU’s own descriptions and interviews. This seems to be a strong argument by OIG.

    WGU Response and Web Site

    WGU’s response was dated May 22 of this year, so they have had time to prepare for the audit findings. They have a web site that explains the situation, answers basic questions, and highlights their arguments against the findings.

    WGU strongly disagrees with the Inspector General’s audit report, which challenges our innovative, results-proven faculty model.

    With this key arguments:

    WGU has complied with the higher education laws and Department of Education guidance since our founding 20 years ago. Students, graduates, and employers of our graduates can rest assured that WGU’s accreditation and financial aid eligibility are intact.

    Our accreditor, the Northwest Commission on Colleges and Universities, has approved our faculty model and reaffirmed our accreditation in February 2017. Accreditors are responsible for determining whether a university is eligible for federal financial aid.

    Fixes Needed

    I agree with both Russ Poulin and Amy Laitinen regarding the need to fix but not remove the “regular and substantive interaction” regulations. From Inside Higher Ed’s coverage:

    Russell Poulin, director of policy and analysis at the WICHE Cooperative for Educational Technologies, said the department has done a “horrible” job of informing colleges about its expectations of how to comply with the regular-and-substantive requirements, which he said have changed over time.

    In addition, he criticized the inspector general’s decision to base its compliance position on disagreement about the mode of teaching at WGU when there is no evidence of any harm to students.

    “I totally agree with the intention of proponents of the ‘regular-and-substantive interaction’ rule, which is to avoid fraud. But it is an outdated method of reaching that goal,” he said via email, comparing it to a hypothetical decision by regulators to remove all ATM card readers because of the risk of credit card skimmers. [snip]

    Amy Laitinen, director of higher education policy for the group and a former Obama administration Education Department official, said the law was a response to rampant fraud and abuse.

    “We need to carefully fix (not gut) the now-outdated law to ensure that students are getting the academic and other supports that they need,” she said via email. “If we don’t do it carefully, it will be a fast race to the bottom, which would be bad for students and bad for the competency-based education community.”

    The Worst Part

    To me the worst part of the audit is the language used by the OIG that tries to make any disagreement with a hyper-literal translation of ambiguous regulations seem to be invalid (page 3).

    None of these 69 courses could reasonably be considered as providing regular and substantive interaction between students and instructors.

    Who holds these “unreasonable” views? The Department of Education and the Northwest Commission are two groups, among others. It’s bad enough that the OIG took the out-of-context, hyper-literal approach to the audit, but to not acknowledge the ambiguity and lack of clear guidance about this requirement is disingenuous.

    This audit is a travesty in my opinion. Even though it is likely to be rejected by the ED itself, it will have an impact, and the internal review of the audit will likely take years. I’ll write more about potential impact of the audit tomorrow.

    Additional Reading

  • Response on LMS Market Size Analysis

    Response on LMS Market Size Analysis

    Josh Kim wrote a post yesterday at Inside Higher Ed questioning some claims about the LMS market size.

    The first result that comes up in Google is from Zion Market Research. Their estimate is that the global LMS market is valued at $5.19 billion in 2016, and expected to reach $19 billion by 2022.

    According to Statista, the LMS market in 2016 was valued at $3.21 billion. CNBC claims that the learning management system market is worth $5.2 billion today, and will grow to $16 billion in four years.

    Can these numbers be right?

    Josh then did a quick analysis based on Instructure’s revenue and came up with much smaller numbers.

    If we assume that the cost of Canvas is about average for LMS companies, we can get an estimate of the total market size by multiplying Instructure’s revenues by five. This gives us an estimate for the total size of the LMS market $555 million.

    He extended this by 50% based on Instructure growth to give an estimate of $555 – $832 million, which is way below the big numbers claimed by Zion, MarketsandMarkets, and other market analysts.

    The biggest difference here is that all of these analysts combine corporate learning markets with academic LMS usage, and corporate learning platforms account for somewhere between $2 – $4 billion, with best estimates (although outdated) coming from Bersin. This point has already been pointed out in the comments at IHE.

    tl;dr – the ~$5 billion number is reasonable if you combine academic and corporate LMS markets.

    There are two caveats, however.

    • First, the market growth claims are marketing fluff to generate interest in buying the reports, as companies love to show growth potential to investors. Anything close to $20 billion in a few years is ludicrous.
    • Second, as Michael commented on this approach based on a post I wrote criticizing MarketsandMarkets:

    If anything, my Phil understates the case here. Lumping higher ed, K12, and corporate LMSs into the same category is a little bit like lumping railroad cars together with automobiles because they are both called cars, have wheels, and carry things and/or people from one place to another. On top of that, nobody has decent data on the size of the global market, never mind the growth of it. MarketsandMarkets’ “analysis” effectively gives us made-up numbers about a mythical automobile/train car market.

    So a better question is what is the size of the global academic LMS markets, combining K-12 and postsecondary?

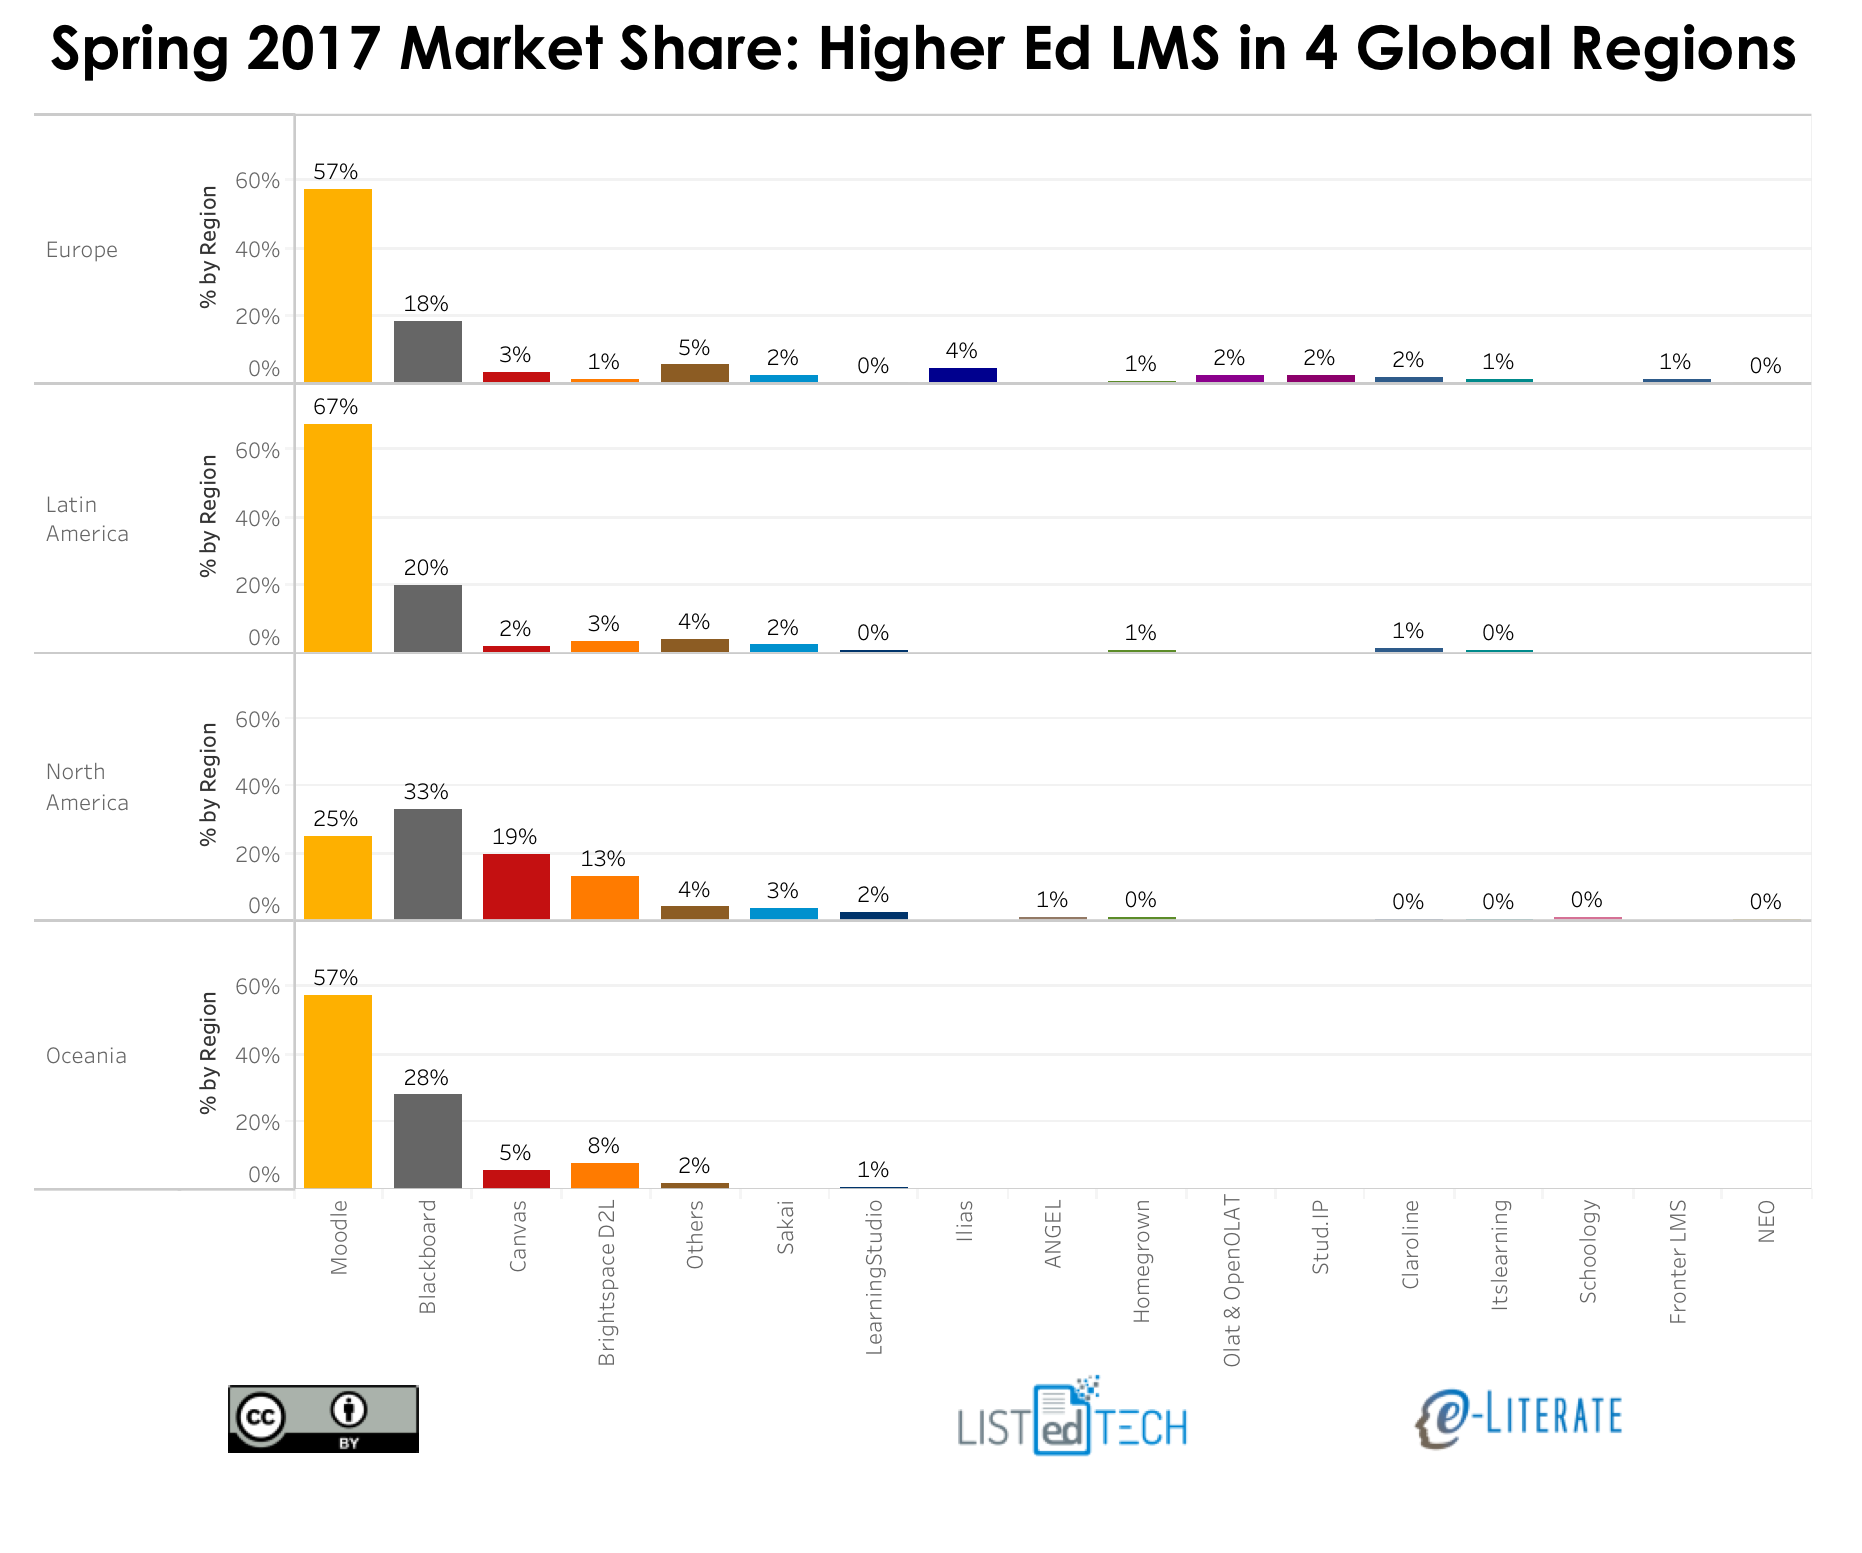
    One issue from the IHE post is that Josh used our 20% market share as basis for extrapolating Instructure’s market share, but that number is only for North American higher education. Globally, Instructure’s market share is much smaller as shown in our recent analysis (data provided by our partners LISTedTECH).

    Furthermore, while Canvas by Instructure and Schoology seem to be leading vendors for new adoptions in the K-12 market, at least in the US, no one has reasonable measures of market share in this area. Long and short – we need a different approach than extrapolation from Instructure alone.

    LISTedTECH estimated the global LMS market just in higher education as $1.7 billion based on (# of students) * (average cost of LMS per student) = annual spending approach. In the US, the best estimates I’ve seen in that K-12 learning platform markets are worth 30 – 40% of higher ed market. This likely is smaller globally, as anecdotally there is not a big emphasis on LMS usage outside North American and Northern Europe. So one very rough estimate is that academic LMS market is worth approximately $2 billion per year.

    If you want to use the company revenue method, then I would use additional data. Blackboard’s LMS revenue is likely $450 – $550 million per year based on reviews of corporate debt filings and extrapolation from their time as a public company. D2L’s revenue is smaller than Instructure’s, so let’s assume the two companies combined have $200 million revenue. Note that in all of these companies this is global revenue for K-12 and higher ed combined. The question is how to scale this $700 million combined revenue from all three companies. Is it reasonable that global spending for academic LMS could be 2 – 3x larger than this number? When you add in all of the Moodle hosting – both Moodle Partners and unofficial Moodle hosting – as well as Chinese market adoption, European providers, and K-12 players like Schoology and Powerschool/Haiku, this seems at least believable.

    So my highly-researched, thoroughly-documented estimate of the global academic LMS market is $1.5 – 2.0 billion per year. And it is forecast to grow to $8.2134526 billion by June 3, 2022.

    Note to investors – ignore that forecast.

  • Some Ed Tech Perspective on UC’s Billion-Dollar Payroll System Fiasco

    Some Ed Tech Perspective on UC’s Billion-Dollar Payroll System Fiasco

    In 2011 the University of California laid out plans for a new payroll system called UCPath (for Payroll, Academic Personnel, Timekeeping, and Human Resources). The goal of the $170 million project was to save a reported $100 million per year eventually and to replace a 30-year-old Payroll Personnel System (PPS) that runs separately for each of the 11 UC locations with Oracle’s PeopleSoft payroll and HR systems. All systems were planned to be live by the end of 2014 and run centrally in a new UCPath processing center.

    In 2014 we described how the project had grown from $170 and 36 months to $220 million and 72 months. In spring of this year we described how the project was planned to cost $504 million and take 93 months (almost five years longer than originally planned).

    A few weeks ago the state auditor released a report claiming that the project would really cost $942 million. The $942 million does not mean that the $504 million estimate has changed since spring, but the auditor does claim that UC is not reporting the full costs of the implementation. From the audit summary on page 1:

    The Office of the President currently projects the implementation cost of UCPath to be $504 million—$334 million over its original estimate of $170 million—and it has delayed the date of UCPath’s implementation by nearly five years, to June 2019. Moreover, the $504 million estimate does not represent the full cost of the project because it includes just a fraction of the cost associated with the campuses’ implementation efforts and a shared services center, known as the UCPath Center. The full cost to the university of adopting UCPath is likely to be at least $942 million.

    Most of this information was available in the spring, but the state auditor makes a compelling, well-documented argument.

    The Worse Part

    However, this is not the big news from the audit. In my 2014 post I commented on Christopher Newfield’s analysis at Remaking the University on the claimed benefits from the project:

    What about the current estimate of benefits – is it $30 million per year as Chris described or closer to $100 million per year? One big concern I have is that the information on project benefits was not updated, presented to the regents, or asked by the regents.

    Well it turns out that was exactly the problem based on this finding from the audit:

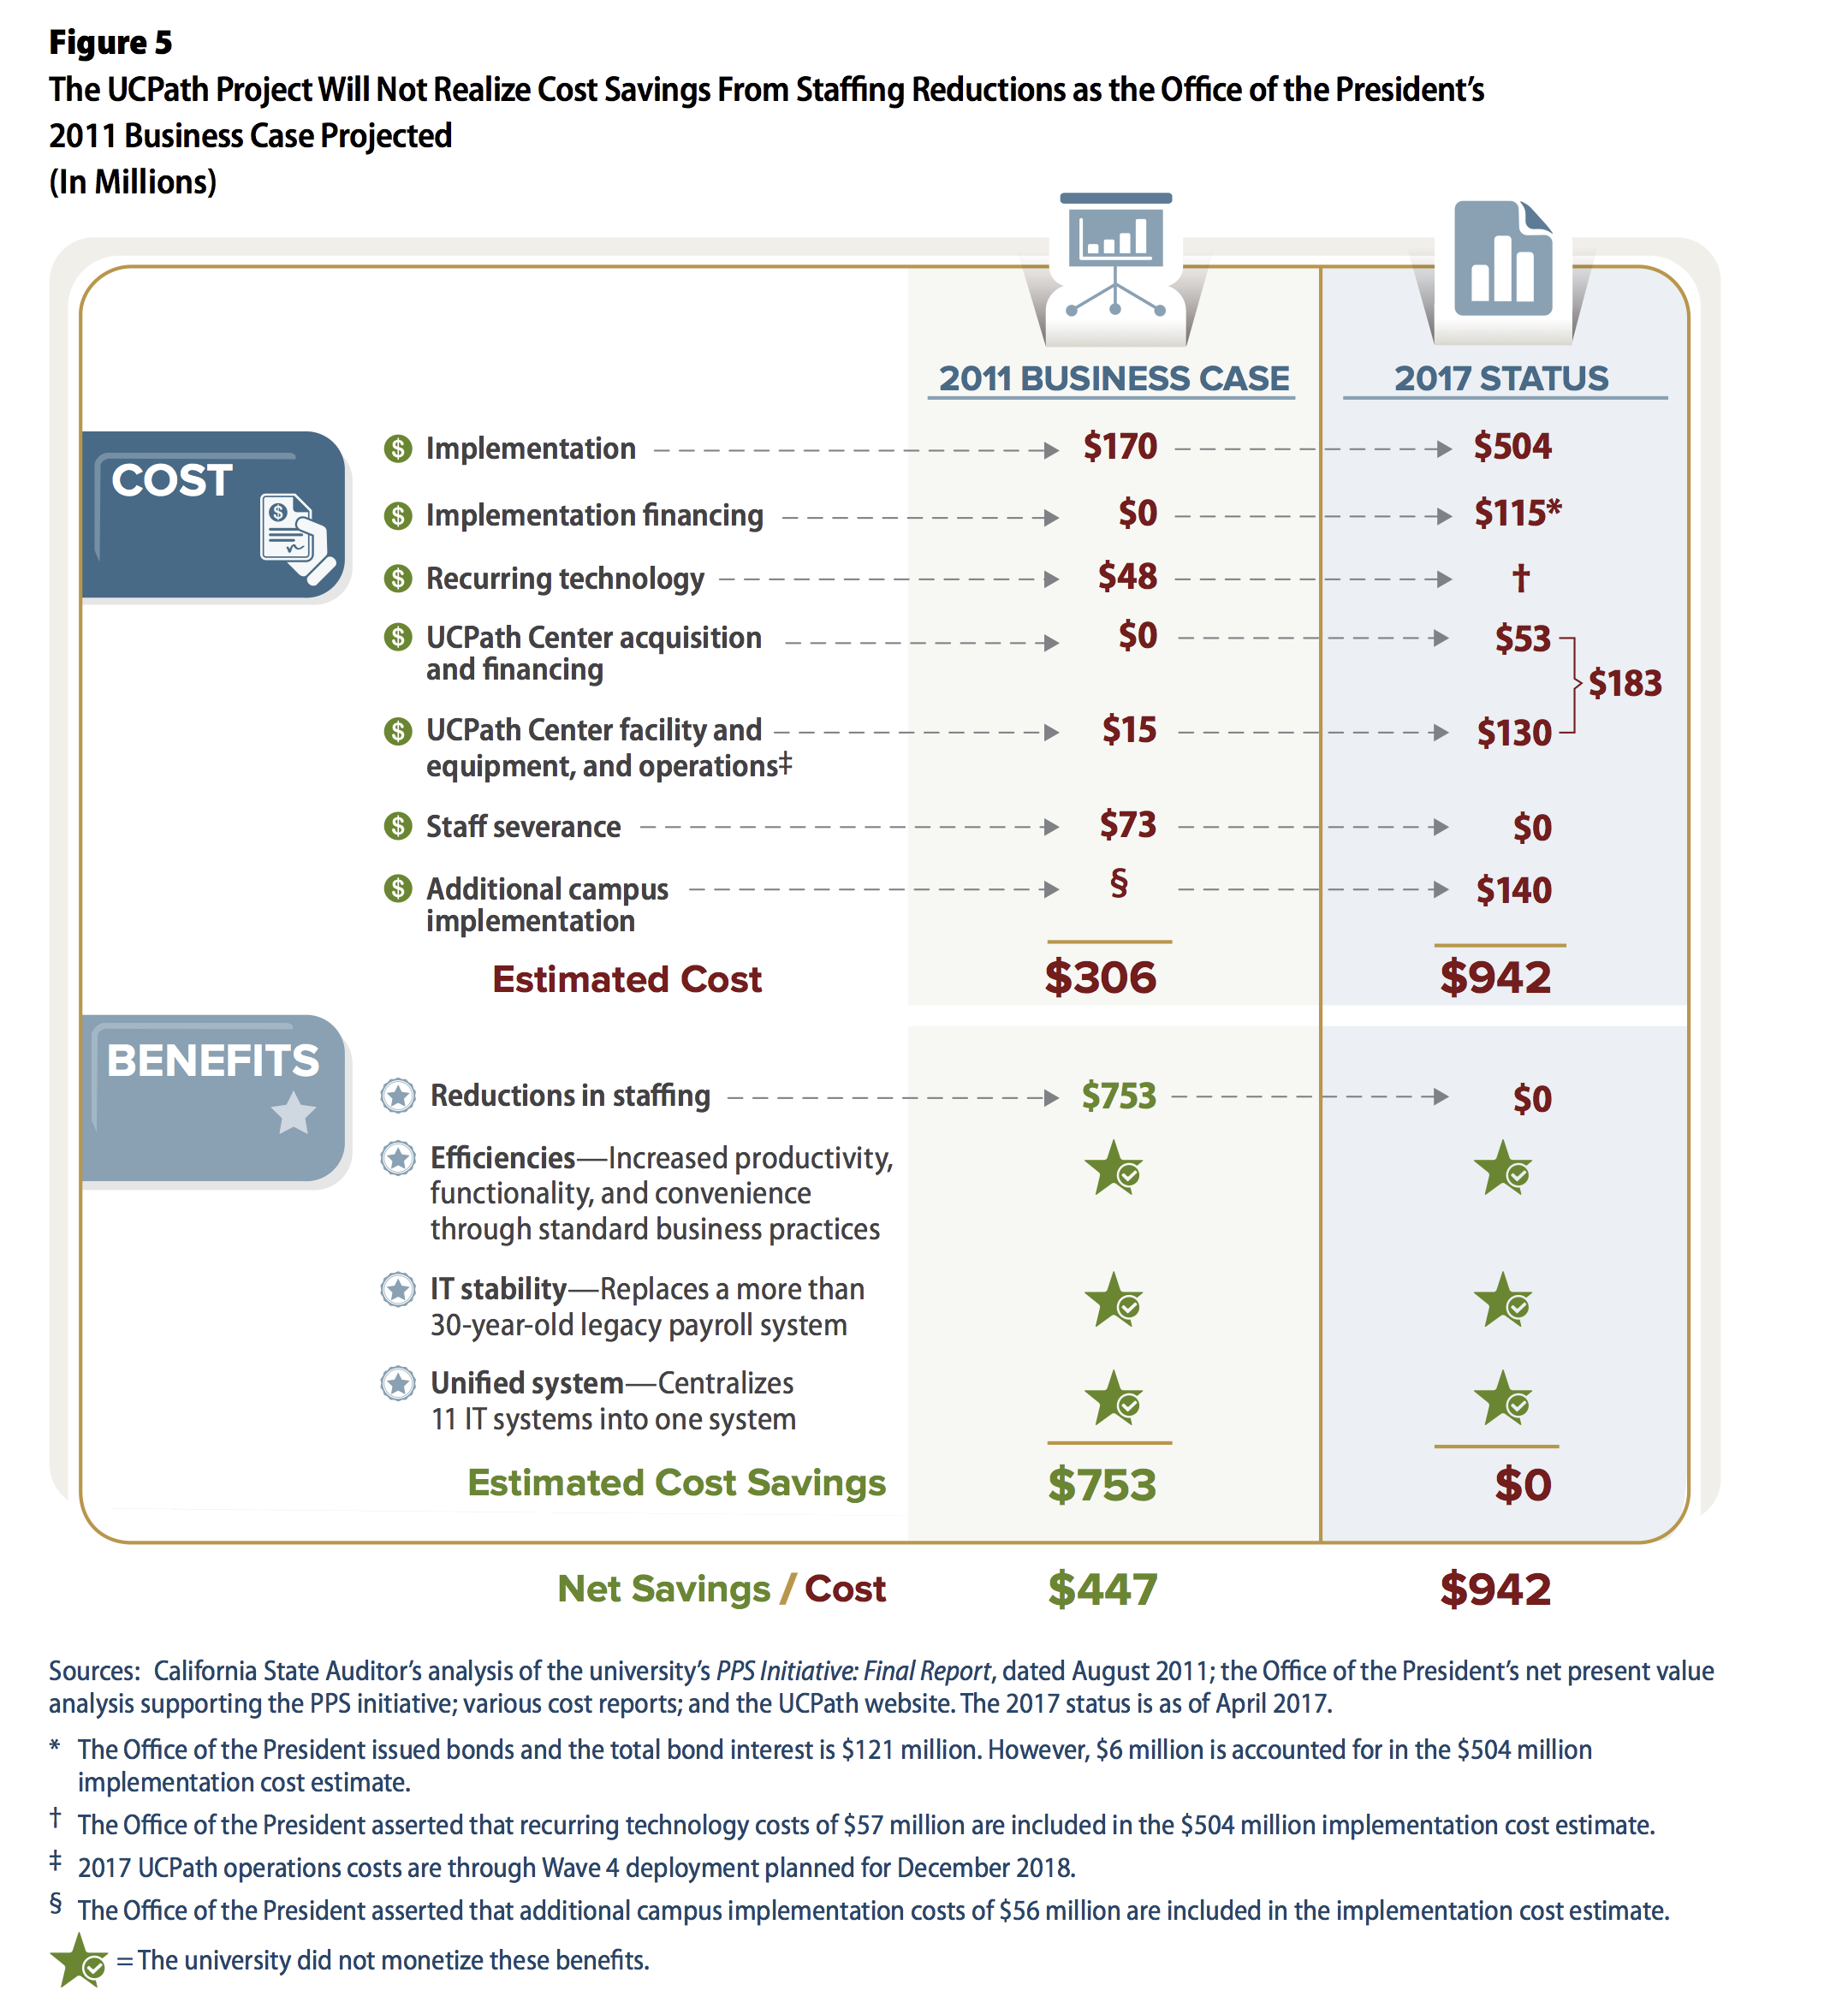
    The Office of the President’s initial business case in 2011 asserted that UCPath would result in $753 million in cost savings, primarily from staffing reductions at the campuses. However, the UCPath project director told us that the Office of the President no longer expects to realize those projected savings. Several campuses also reported to us that they do not anticipate the staff reductions that the 2011 business case promised. In fact, in a status update to the University of California Board of Regents (regents) in July 2017, the Office of the President did not discuss any offsetting savings but rather discussed creating efficiencies and avoiding costs.

    You read that right. The $753 million in savings that was the basis for the project is not going to materialize. There clearly was a need to replace 30 year old systems, but the justification for the UCPath project and its specific approach was based on large staff cuts to be achieved by centralizing payroll for all 10 universities in the system. To get the true scale of the cost impacts of this project, look at this helpful chart from page 16 of the audit (note the $504 million in top right – that is the cost claimed by UC):

    What this means is that the net savings / cost have changed by almost $1.4 billion. Let that sink in. Billion with a ‘b’.

    UC Response

    The University of California Office of the President (UCOP) responded to the audit both formally in the audit report itself and informally through media statements. The official UCOP statement starting on page 35 of the audit mostly notes that President Napolitano was not at UC when UCPath started, that this is a necessary and complex project, claims they have already made improvements, and it disputes some of the specific recommendations as being heavy-handed. But at no point does UCOP dispute the findings. What is most problematic is the emphatic claim at the end:

    I have complete confidence in UC’s ability to continue successful implementation of UCPath, a necessary project with significant, expansive, and long-term benefits to the University.

    There is no serious re-questioning of assumptions or of UC’s ability to finish the job, despite plenty of evidence pointing to fundamental problems in the project.

    The UC response in the UCLA paper is even more problematic, as it mostly argues that the implementation only costs $504 million many other items are operational in nature.

    Claire Doan, a UC Office of the President spokesperson, said the state audit includes additional costs that should not contribute to the overall cost estimate. [snip]

    The UCPath Center will assume all payroll and human resources functions systemwide, according to the state audit. Doan added the UC believes the $130 million the state audit cited for the center’s operating cost should be included in the project’s operations budget, rather than its implementation budget, because the UC does not typically include operating expenses in project implementation costs.

    In other words, UCOP is complaining about accounting methods while not disputing the findings. UCOP wants to just look at IT implementation costs, while the state auditor is looking at “the full cost to the university of adopting UCPath”.

    Some Perspective

    We here at e-Literate are focused more on ed tech – the impact of changes to teaching and learning enabled by technology. So it might help to add some ed tech perspective on this story.

    Taking the well-grounded assumption that the project, or some form of it, was necessary, and making the assumption that UC’s original plan made some sense ($170 million for IT implementation), let’s look just at the impact of cost overruns.

    • Using the UCOP argument, the IT implementation cost overrun is currently $334 million
    • Using the state auditor argument, the total UCPath cost overrun is currently $636 million
    • Adding in the disappearance of planned savings, the change in savings / cost is almost $1.4 billion

    Keep in mind that much of the project is funded by a 20-year bond. Some comparisons using that time frame (we’ll factor in inflation and cost increases by adding 1.5x for a range):

    • Based on typical UC campus costs and extrapolating, the cost of providing an LMS for every UC campus for 20 years is likely $66 – $99 million
    • Using EDUCAUSE Core Data of $96 – $110 per student median spend in the US, the costs of centralized instructional technology support of all applications and services for every UC campus for 20 years is likely $500 –  $850 million

    The fallout from UCPath’s cost overruns and loss of planned savings likely exceeds the entire combined instructional technology budget for all 10 UC campuses. This project matters.

  • California Should Watch Arkansas Process for Creating New Online Institution

    California Should Watch Arkansas Process for Creating New Online Institution

    Two months ago I wrote a post about Governor Brown’s directive for a fully-online community college in California, noting that:

    What this points to is that for a new fully-online institution to get to some meaningful level of enrollment (let’s say 20,000) in the same ballpark as these comparison schools, I estimate it would take a full decade at the least. This is the reason, by the way, that Mitch Daniels and Purdue University made the Kaplan University deal even though Kaplan’s enrollments are dropping. Daniels did not want to wait a decade to get to meaningful enrollment numbers for an online college serving working adults – if everything works out, within a year Purdue will have a fully-online institution serving 30,000+ working adults. That is a big if, by the way.

    This estimate is probably optimistic, however, based on the outlook for eVersity, the fully-online institution being created in the state of Arkansas. The eVersity leaders have decided that they cannot wait for regional accreditation as reported at Inside Higher Ed today [emphasis added].

    When the University of Arkansas System envisioned creating the online-only institution eVersity in 2014, it planned to follow the well-worn path trodden by other public higher education systems in launching fully online institutions: building on the accreditation of the system’s other universities before seeking independent approval from the regional accreditor.

    But come January, eVersity will seek approval from the Distance Education Accrediting Commission — a national body that overwhelmingly accredits for-profit and nonprofit online institutions — rather than the Higher Learning Commission, which accredits all other public institutions in Arkansas and many nonprofit colleges in 18 other states.

    One of the primary factors shaping eVersity’s decision is speed. The regional accreditor told the university that it could take roughly six years for HLC to award its stamp of approval, while DEAC — assuming it affirms eVersity in January — will have acted in just under two years. Institutional accreditation is required for eVersity students to gain access to federal financial aid, and to ensure that their credentials are valued by employers and others.

    The challenge with national accreditation includes severe limitations on students being able to transfer credits out of the school.

    On the issue of speed, [senior policy analyst at the Center for American Progress] Flores noted that institutions waiting for regional accreditation can often apply for federal aid during the candidacy stage of their application, and that students who attend regionally accredited institutions will have a much easier time transferring their credits than those who attend nationally accredited ones. Flores said eVersity seemed like “a little bit of an odd fit” for DEAC, which typically accredits smaller for-profit institutions that don’t offer federal aid.

    The IHE article (very well-written, by the way) described the path chosen by previous fully-online institutions.

    A more conventional route to regional accreditation, however, is to start as a division of an already regionally accredited campus, said Goldstein. This is what the University of Maryland University College did before obtaining independent regional accreditation. Colorado State University Global Campus also went this route.

    [Chief academic and operating officer of eVersity] Moore said that eVersity decided not to do that, as it did not want to be under the academic and administrative control of another University of Arkansas System institution. “We wanted the ability to be nimble and responsive and not burdened by legacy systems, practices and policies. There are certainly advantages to built-in infrastructures, but they also come with a cost,” said Moore.

    Think about the implications – if a state wants a new, fully-online institution to serve working adults, there seems to be four choices before there is meaningful impact in numbers of students enrolled in institution:

    • Establish new, separate institution, choose regional accreditation, be patient in realistic enrollment growth, and expect 10 – 15 years for meaningful impact
    • Do the above but choose national accreditation and limit transfer ability and possibly impact enrollment, and expect 6 – 11 years
    • Establish division of another school using their accreditation, then spin off for separate institution later on, and risk getting caught up in traditional institution’s legacy policies and practices (unknown timescale)
    • Pull a Mitch Daniels and buy an existing online (or mostly online) institution through creative process, risk not being approved due to transfer of control, and risk getting caught up in the online institution’s legacy policies and practices – and expect 2 – 3 years if the bet works out

    California likely faces similar choices with the fully-online college directive being evaluated this fall. This is a legacy-building project, but there will be real pressure to not have to wait 10 – 15 years to start getting meaningful impact. eVersity from Arkansas is going through this same process ahead of time, and the California team should learn lessons by watching what works and doesn’t work in this case.

    More broadly, the IHE article ends with a key point about accreditation needing to change.

    Russell Poulin, director of policy and analysis at the WICHE Cooperative for Educational Technologies, said that accreditors needed to figure out how to accredit new providers more quickly, without compromising on quality. “Accreditation is slow and innovation is fast; we are starting to see political and business pressure to find alternatives,” he said.

    Read the entire IHE article. This subject is important.

  • InstructureCon 2017: Culture as a competitive weapon

    InstructureCon 2017: Culture as a competitive weapon

    In our recent coverage of BbWorld and D2L Fusion, Michael and I came away impressed. Both companies are improving and doing so in ways showing them listening to customers, empathizing, and developing product enhancements with more engaging user experiences. Both companies are doing so by attempting to change their company cultures to support these behaviors. Their challenge, however, is that Instructure is already there – their company culture has supported simplicity, customer-centric empathy, and openness from day one. And what struck me (again) at this year’s InstructureCon was how well the company is managed and how consistent is their approach, over time and throughout the organization.

    Instructure launched its Canvas LMS back in 2010, and it is remarkable how Michael’s description from June 2010 could still be applied today.

    If I had to summarize Instructure’s strategy in one sentence, it would be “They use the lessons learned by consumer web companies to clear the clutter out of LMS software design and business model.” They’re not focusing particularly on open education or analytics or any other hot topics in online education, although they are aware of these and do pay some attention to them. Rather, they are looking at core use cases and trying to make them as simple as possible, throwing out some outdated LMS design assumptions in the process.

    From the early days when they had dozens of employees to today, when they have over 1,100 employees, the strategy is the same and the company culture is the same. This despite the departure of both founders and the 2015 IPO and all the resultant pressure from investors.

    This is Instructure’s secret. They continue to manage the company to support the strategy of clearing the clutter out of LMS software design and business models.

    Product News

    The biggest product news at InstructureCon this year:

    • Release of Gauge, an assessment management platform for K-12 usage, which might impact higher ed in the future
    • Redesigned Quiz engine and Gradebook, leading to what we saw as the biggest interest from conference attendees
    • Release of blueprint courses
    • Investment in back-end platform design (e.g. microservices) to increase speed of design improvements
    • Reintroduction of analytics – visualizations initially targeted at faculty usage
    • Introduction of Alexa integration

    The focus on assessments, quizzes and grade books is both problematic and encouraging. Problematic for the industry as we spend too much time on measurements and grading and accountability and too little time on learning and continuous formative assessment. Yes, the quizzing engine can be used for formative assessment, but in most cases the usage is for summative assessment. But even with this viewpoint, it is encouraging that the primary focus of these product enhancements to Canvas is on reducing the time spent on the grading activities. It is a fact of life that an enormous amount of effort is spent by faculty, particularly in the US, on managing grades. It is good to see tools that directly reduce the pain in this area.

    In a standing-room only session, Instructure’s Christi Wruck explained the initial phase of a multi-year effort to redesign and improve the grade book. Most features shown were of the nature of reducing the number of clicks or simplifying the navigation of grading activities. I won’t go into the minutiae here, but this session seemed to generate the most excitement at the conference.

    The (re)introduction of analytics surprised me, as I had seen most public efforts in Canvas lately focusing on getting data out to let customers do their own analytics. The initial analytics in Canvas were introduced in 2012, and there were and are a few cool visualizations for faculty mostly, but there is little meat on the bones. There never seemed to be a real product strategy on the developing role of analytics within an LMS nor a full team to work on this challenge. In the meantime they rolled out Canvas Data, which we have talked to staff from several colleges and universities who are actively playing with and exploring the data. But this year Instructure described how they’ve been hiring a new analytics team and working on new visualizations. As with the previous effort, the initial focus is on helping faculty get a better view of how students are performing. We will have to watch this current focus on analytics to see if a real strategy develops.

    Blueprint Courses is a overdue features set to allow course design templates or components across courses or shared between instructors. This capability finally provides direct support for centralized course design models involving master courses and multiple course shells as typically used in large online programs. While this capability could be considered late, conference attendees seemed to be quite impressed with the design of the new features.

    Market News

    I shared in my post on D2L’s Fusion conference how their Brightspace LMS has made impressive wins recently, particularly for schools with large online programs. Canvas continues to gain market share and lead all competitors in new implementations (schools choosing a new LMS), but over the past 12 months they’ve allowed D2L to at least become a clear competitor.

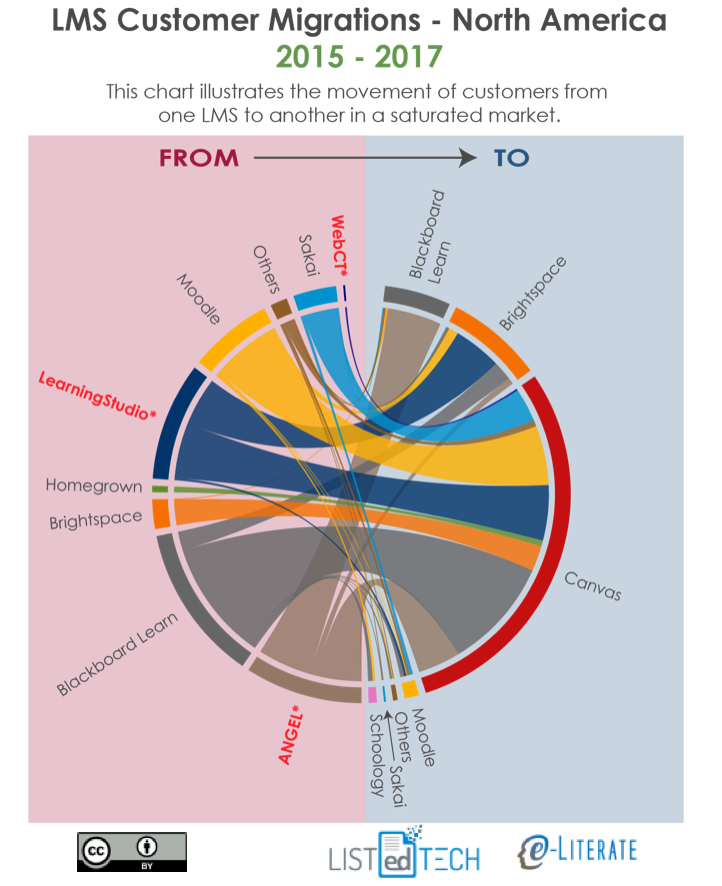
    Michael also shared a view from the North American (US and Canada) market for higher education showing that most of Blackboard’s “wins” over the past few years have come from ANGEL end-of-life migrations. Looking at that same image, however, it becomes even more obvious just how well Canvas has performed for new implementations. It is not just that Canvas has the lion’s share of new implementations, it’s also the breadth of migrations coming from Blackboard Learn, Moodle, ANGEL, LearningStudio, Sakai, and even several from D2L Brightspace.

    Instructure has recorded strong international grown in just the past two years, and this interest was evident at the conference. The most notable difference between the early users conferences and this year’s event was the expansion of the customer base. There must be similar numbers of K-12 attendees as there are higher education attendees, and we’re now seeing clients from Europe, Latin America, and Australia & New Zealand.

    Just 2-3 years ago Canvas as an LMS brand was virtually unknown outside of the US and Canada, but now Canvas is winning more than any others in North America, Europe, Latin America, and Oceania.

    Challenges

    Instructure certainly has challenges to face. In terms of market share, it will be very interesting to look at data for the end of 2017 to see if D2L has maintained its momentum in new implementations. And being a publicly-traded company, investors care not just that Instructure is growing but also whether Instructure is growing fast enough in multiple markets. That’s a lot of pressure.

    On the product front, Canvas was late to the game in terms of supporting mastery learning and associated competency-based education initiatives, although their introduction of MasteryPaths is showing some ability to catch up. Likewise, they certainly are behind their competitors in terms of learning analytics and associated research. And I would even say that they are late in supporting centralized course design models. In all three areas, there are initiatives introduced over the past 12 months to address these product needs. The challenge is for the company to catch up with competitors not necessarily in terms of full feature sets, but more in terms of supporting basic use cases and doing it well.

    When I asked various Instructure management at the conference whom they saw as their greatest competitor, the most common answer was themselves. The company knows they have work to do, and there is a real sense of “we have to do better” that permeates the company. For Instructure’s competitors, the good news is that Canvas has weaknesses. The bad news is that the company knows it.

    Back to Culture

    But the real event of InstructureCon is not really based on product news or market share. As Michael noted last year:

    Throughout the conference, I asked a number of attendees what percentage of their motivation for coming was to find out what the company was planning to develop in the next year. The range of answers averaged between 10% and 20%. They all told me that, while they were looking forward to the roadmap sessions later in the week, they didn’t expect any big surprises and weren’t all that focused on finding out what the developers had been doing. I have never been at an LMS conference where that was true, including Sakai conferences and Moodle Moots.

    Consider the Instructure company profile at Glassdoor. Last year the company was rated #4 best place to work for all small and medium-sized businesses, and Josh Coates was rated #15 for all CEOs in the same category. But also look at the video that Instructure management chose to include in the “Why Work For Us?” section. Other companies tend to put up platitude-filled dreck that tells you very little about their company. But Instructure puts up a 7+ minute video where they talk primarily about company values. In the video, they talk about the behavior the company does and doesn’t want – and even nods that they’ll get rid of people who have have these behaviors – and they avoid all the pseudo-inspirational messages.

    While Canvas is a market-changing platform, that is not really Instructure’s primary strength. Instructure as a company is the real strength.

  • LMS Revival: D2L picking up new customers and showing they can listen

    LMS Revival: D2L picking up new customers and showing they can listen

    D2L the company and Brightspace the company’s LMS are undergoing something of a revival in the past year. It’s not as if they have dropped in terms of market share – in fact the have a history of strong client retention, losing few customers – but the early 2010’s did not lead to rapid customer growth as they had expected after raising two rounds of a combined $165 million in 2012 and 2014. If you read that second post you’ll find that I stated that their growth claims “defied logic” at the time. Recently, however, D2L is on a roll, racking up significant client wins in higher education, and the company shows real signs of change and its ability to truly listen to and empathize with customers.

    As I sat down to write my analysis of the D2L Fusion users conference and what it meant to the Brightspace LMS, I noticed that several of the same themes I described last year applied to this year’s observations – just updated in terms of effect on customers and whether the changes seem to be sticking. To explain my current thoughts it is useful to start with commentary from last year.

    Update on Listening and Product Changes

    From last year’s post:

    As I have described to several executives at D2L, there is an interesting gap between the progress we have seen with the company’s product improvements and the reaction we hear from many of their customers. With the tighter integration with LeaP and the improved usability, particularly in content authoring, I would have expected to hear more customers react to the changes. But when talking directly to many of the institutions using the Brightspace LMS, staff describe D2L as if the company and product line had not changed in several years. What is not clear is whether this gap is due the company missing the mark (and my judgement of improvements not aligning with what colleges and universities want) or whether there is just a lag where it will take time for most customers to believe in and take advantage the new product designs and features.

    2016 has been an eventful year for D2L. [Chief Operating Officer] COO Cheryl Ainoa, a longtime veteran of Yahoo! and most recently Intuit, joined the company in April. Although this move was not advertised through press releases or even blog posts, I believe this is a significant change to how the company operates. [snip]

    And this gets back to the gap noted in the first paragraph. When I talk to people at schools migrating from D2L or considering whether to migrate, I do not hear much about the recent product changes or the new management described above. For several of these schools, the issue isn’t even whether they like or dislike the recent product and management changes, it’s as if these changes are a non issue in their decision-making. No conclusions yet, just noting the gap.

    What I noticed since last year are two updates to the above analysis.

    Listening – Besides adding a new COO, D2L has made several other executive-level hires in the product in the past two years, and to me it seems like we are seeing a new way of thinking largely caused by this new group. The interviews with executives were much more consistent than in past years, and there is a new focus on actively listening to customers. It’s not that D2L didn’t have conversations before; it’s more that they didn’t know how to truly listen and empathize.Part of this change according to D2L exec interviews was that in the past it was easier to talk to CIOs, but now they are learning how to talk to faculty and end users. All interviewees seemed to be singing from the same hymnbook. For the most part.

    Narrow but Excellent – The product focus is less on big-news features and more on small-news everyday items. In the past D2L has seemed too interested in being able to do some chest-thumping “We’ve got CBE. We’ve got Predictive Analytics. We’ve got Adaptive Learning.” while missing something on what current and even prospective customers need in their daily lives. The new focus is more on taking the drudgery out of end-user activities with a mantra of “narrow but excellent”. They are trying to fall in love with problem solving more than in features, even if these problems can be non-sexy.

    One example from the Fusion users conference was making it easier to shuffle questions within a quiz. Sounds trivial, but Canius College staff have a description that captures the essence of the change. Yes, you could have done this before, but it was a chore. Now it’s much easier to the point that more people will want to use it.

    Later this month, D2L will introduce a nice feature for Canisius faculty who use their online quiz/exam tool. D2L’s quiz engine has powerful features for randomizing question order in a quiz or exam, and can even deliver a subset of questions at random from larger question banks. This is nice, but until now it was a bit of a chore if you only wanted to randomize delivery of, say, five to ten questions, since you needed to install those questions in the question library, and then import them into a random section within the quiz. Along the way, there were a lot of clicks and the process wasn’t always so intuitive. With the update coming late July, D2L has installed a checkbox feature within the quiz editor: “Shuffle order of questions at the quiz level.” Simply add your questions directly in the quiz, click that box, and the quiz will deliver those questions in a random order to each student.

    The Brightspace product demonstrations during the conference keynote got significant spontaneous reactions from crowd (along with hallway discussions) likely reflecting this improved ability to listen
    to customers. And the improvement to quiz question shuffling led to one of the biggest reactions.

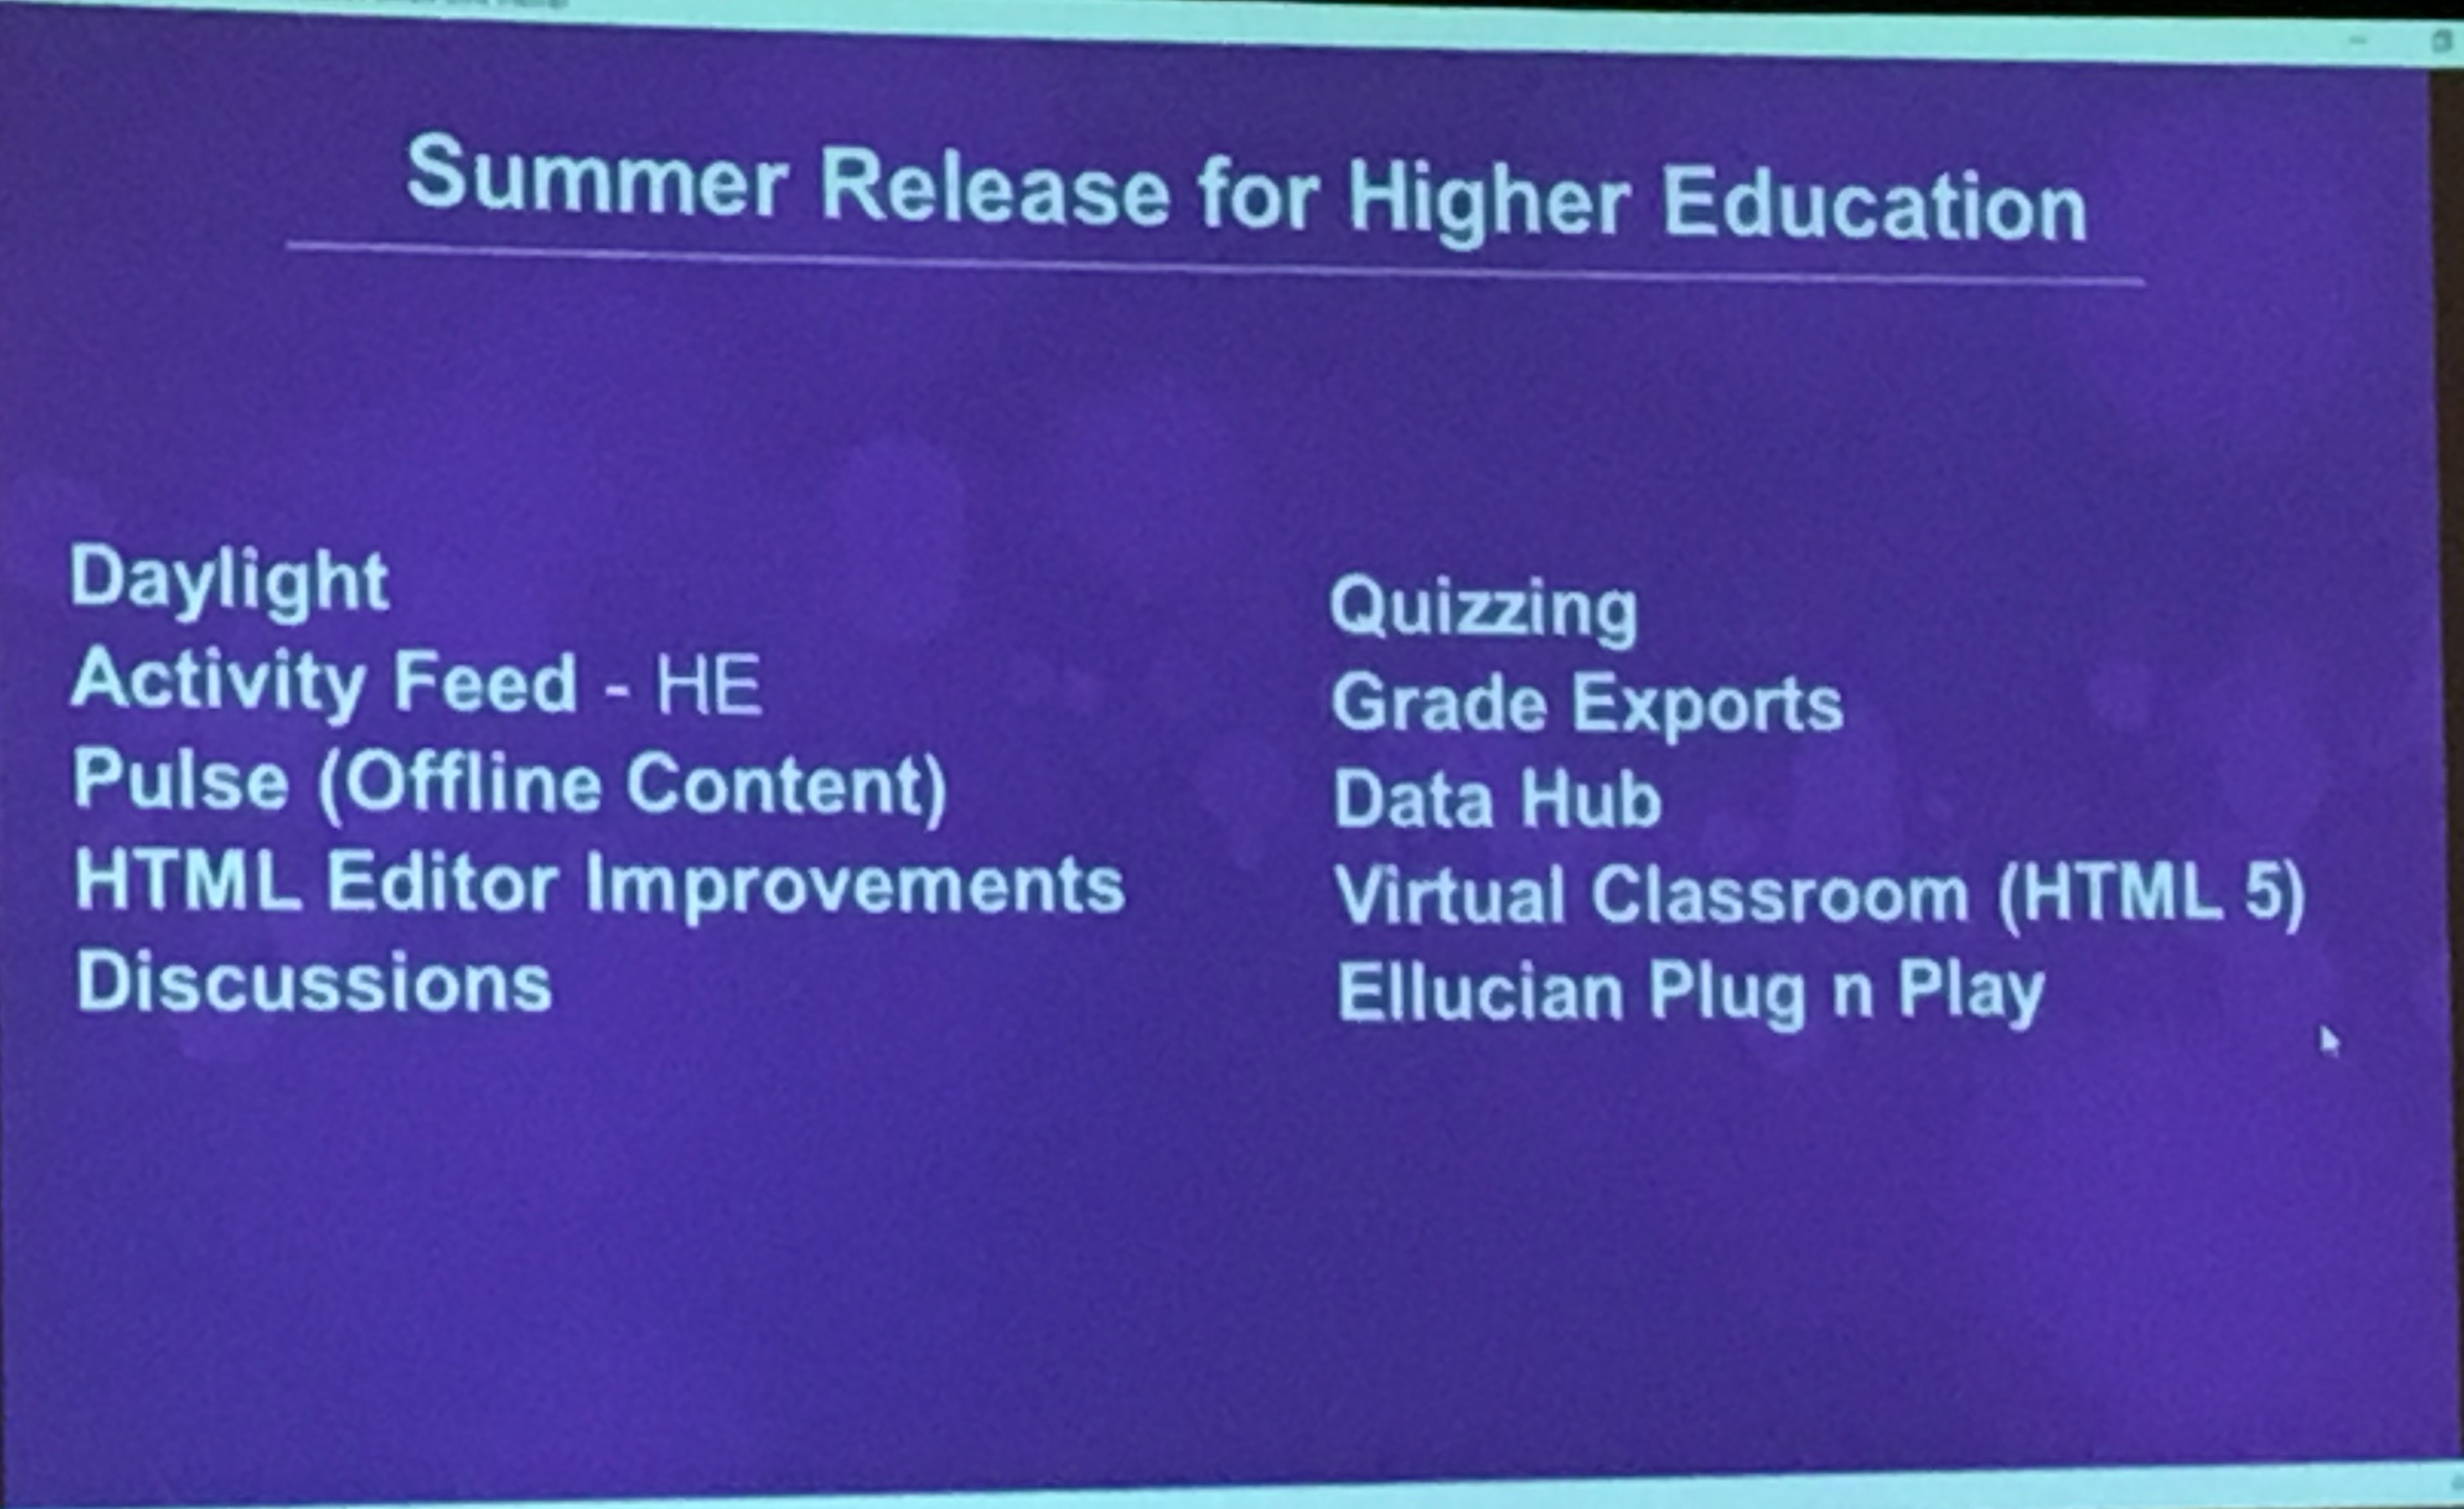
    Here are the major product announcements / new functionality as of this summer:

    Another product change worth noting is the new Data Hub. This is a re-architecture of how data can be exported to allow bulk access to data, either manual or through application program interfaces (APIs). The announcement is significant as we have noted in the past that D2L has had challenges getting data reliably and quickly to customers. Data export is not an easy problem to solve due to the complex technical challenges involved in analytics, and D2L had its share of customer challenges several years ago. However, we heard from at least one customer with early access to the Data Hub that their situation is improving. Sounds trivial, but this could be significant. We will have to keep a close watch on this development.

    Update on Market Share

    In last year’s post I noted:

    On the sales front, D2L has experienced somewhat slow but steady growth in new US / Canadian higher education clients as seen below, but they have not had the big-name wins of the caliber of UMUC, Tennessee Board of Regents, University System of Georgia, as they had 2013 and earlier.

    They had won Kaplan University as of last year, but since then they’ve also won with EDMC, Saint Leo University, University of Cardiff, University of Ottawa, Bournemouth University, and most recently Southern New Hampshire University (SNHU), among others. In other words, over the past 12 months D2L has won several big-name accounts in higher education. ((Disclosure: I advised UMUC during their strategy and evaluation process in 2011-2012. Bournemouth, SNHU, and D2L are subscribers to our LMS market analysis service.))

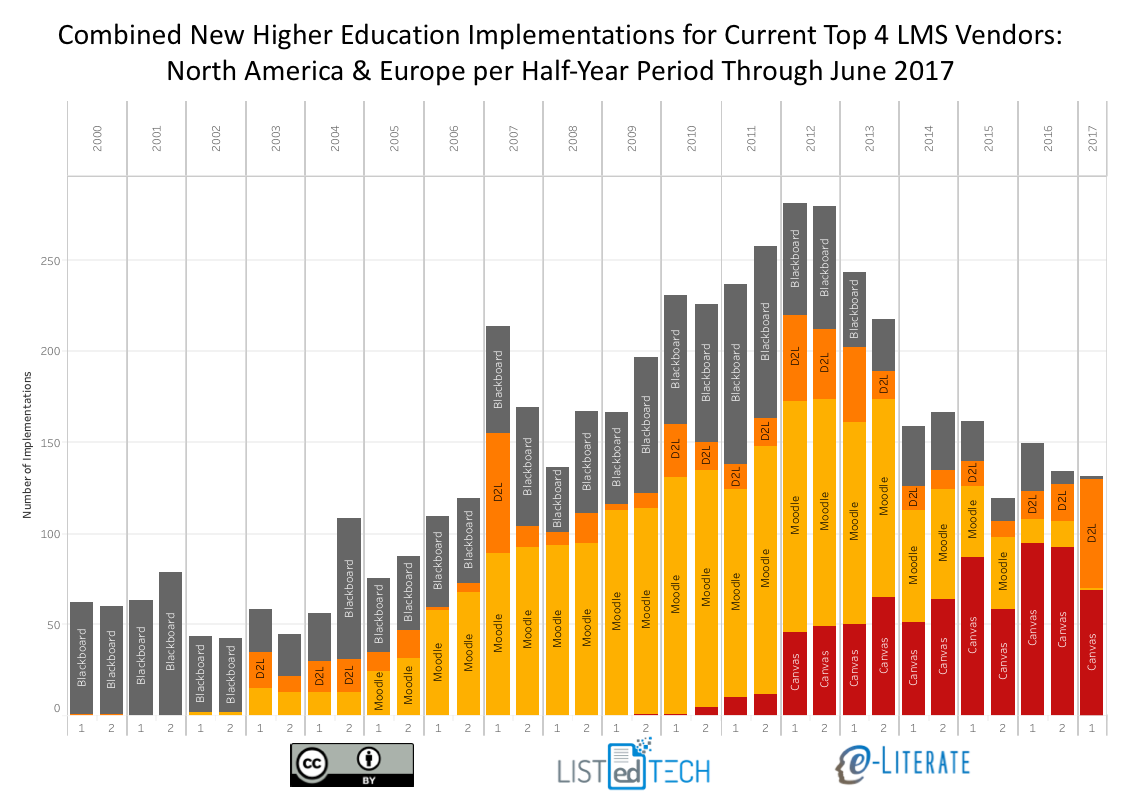
    The net effect has been a dramatic uptick in the percentage of new implementations (schools switching from another LMS to a new one) for D2L. The following chart looks at new implementations in North America (US and Canada) and Europe highlighting the top four academic LMS solutions (Blackboard, Moodle, Canvas, D2L) in half-year increments, with a remarkable spike in D2L’s activities in the past 12 months.

    This data aligns with our anecdotal conversations where, more often than not, there seems to be a pattern of new implementations going to Canvas or D2L – an emerging two-horse race for new implementations.

    Part of the reason for the recent acceleration and for the unknown future is the fact that quite a few of D2L’s wins for Brightspace have been large systems (single decision affecting multiple campuses, e.g. Kaplan University) or large enrollment single institutions (e.g. SNHU). And many of these are for schools with large, centrally-managed online operations. The large systems have benefitted from the Pearson LearningStudio (aka eCollege) end-of-life forcing many for-profit systems to change LMS, with that activity mostly running its course by the end of this calendar year. Big wins, but quite dependent on a small number of deals.

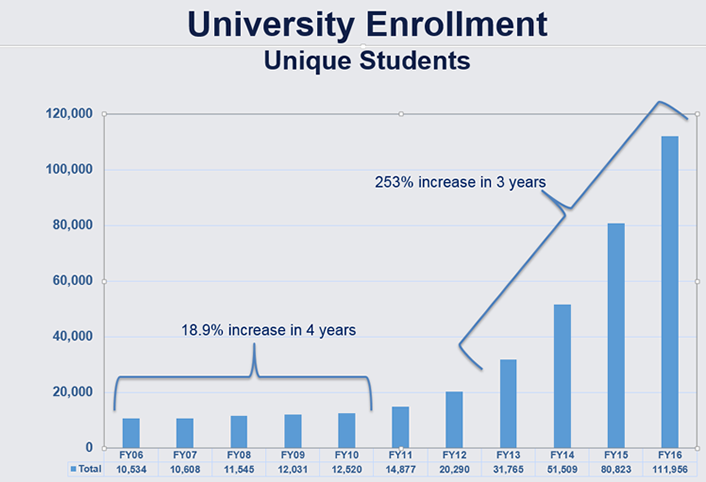
    The recent win at SNHU is very important to understand, however. It is not driven by end-of-life (SNHU moving off of Blackboard Learn in a voluntary migration), and this comes from a long-time Blackboard customer. Quite often people equate SNHU with its College for America (CfA), one of the leading competency-based education (CBE) programs in the country. But SNHU is much bigger than CfA, and it is the fastest-growing university in North America overall. According to an article last year in EDUCAUSE Review, SNHU’s online enrollment has grown at 253% per year over the past several years.

    It certainly seems probable that this increase in market wins is related to the change in how D2L listens to customers and the resultant change in emphasis from big-news capabilities towards smaller-news but customer-pleasing improvements to everyday functionality. It is important that Brightspace has such a deep feature set, but have the company understand customer everyday needs is more important.

    What we do know is that D2L has increased its number of higher education wins over the past 12 months. What we don’t know is whether and how strongly this trend will continue.

    Update on Conference Attendance

    This was the first on-site Fusion visit we’ve had in a couple of years, leading to the title and commentary in last year’s post “Changes at D2L: A second-hand view from users conference”:

    The reason I titled this post as a second-hand view is that D2L is the only major LMS provider (and I include Moodle and Sakai here) that discouraged our participation in their users conference (and we did not attend), citing concerns over direct conversations with attendees without getting their permission first. Other providers are happy to allow and even encourage this type of interaction. In the nature of full disclosure, we think it is important for the reader to understand this difference in access.

    Michael and I value the ability to not just hear official presentations and get in-depth demos, but to also go, roam, and talk to customers.

    True to their word, D2L management have changed their approach on how analysts can be involved in their conference. This year we were invited to attend (along with others), and more importantly, we were allowed to freely talk to the users and prospective users at the conference. I even had several people from D2L pass me in the hallway and ask if I was getting the access to customers that I needed. I did.

    This change aligns with the aforementioned improvements and focus on how D2L as a company listens to customers. Less control and more desire to learn (sorry, couldn’t help myself). A welcome change.

    Open Questions

    While most of what we’ve seen in the market and at the conference has been an improvement over the past few years, it is important to understand the tall order of the changes being made.

    Learning to listen, especially to end users, really represents a cultural change, and these changes are not easy. They take a lot of management time and energy to implement, and they take patience. Will these changes take hold and further permeate the organization? Certainly we’re seeing results over the past 12 months, but companies have plenty of pressures to fall back into old habits.

    In terms of market positioning, the competition is not standing still. We’re also seeing improvements coming from Blackboard’s change in executive team, and we’re seeing Instructure to continue their strong improvements to Canvas and their support. New entrants like Schoology and older solutions like Moodle are also improving, albeit more slowly than the big commercial vendors. Further complicating the matter, a lot of D2L’s new business came from a handful of large decisions. Will D2L’s market momentum of new implementations continue, particularly in North America and Europe? I expect we’ll learn a lot when we look at the data at the end of this calendar year.