e-Literate

Present is Prologue

Author: Phil Hill

  • Big Changes at Unizin: CEO and COO resign after board meeting

    Big Changes at Unizin: CEO and COO resign after board meeting

    Three and a half years after its formation, Unizin is facing its biggest challenge. Now that the consortium is dealing with contract renewals (membership based on three-year agreements), and now that it is a standalone organization and not wrapped under Internet2, Unizin will face the future without its top management.

    There’s a lot more here than just a change of one or two executives, and we plan to share more analysis next week here at e-Literate. We have also reached out to get comments from the various people involved. For now, however, here are the basics.

    This week there were two board meetings in Austin, TX – one for Unizin and one for Kuali – due to the logistics of having several people serving on both boards. We have confirmed based on multiple sources that after a meeting with the Unizin executive committee but before the board meeting, CEO Amin Qazi turned in his resignation. One day later, after the board approved a new interim CEO, COO Robin Littleworth turned in his resignation.

    The interim CEO is Rob Lowden, Associate VP Enterprise Systems at Indiana University and long-time active member of the Kuali community and prior to that in the Sakai community (including board positions in those two open source organizations). To the best of my knowledge, Lowden will remain in his job at IU while at the same time running Unizin until the board selects new executives.

    Expect more from us next week.

    Update: Clarified timing of resignation.

  • Cengage OpenNow: Big news on the OER front hiding in plain sight

    Cengage OpenNow: Big news on the OER front hiding in plain sight

    In the week prior to the OpenEd conference, Cengage Learning made a fairly big announcement with OpenNow, a “suite of digital products for general education courses with open educational resources (OER) content”. In an article from Inside Higher Education, I noted that this news was not out of the blue.

    Phil Hill, the co-publisher of the blog e-Literate and a partner at MindWires Consulting, said he was not surprised by Cengage’s OER announcement. “If you’ve been paying attention, you’ll know that Cengage has been saying for at least a year that they wanted to get into this space,” he said. Hill says he was surprised, however, at how aggressively Cengage seemed to be promoting OER with this announcement. “We’ve seen other publishers dipping their toes in, but this seems as if it is central to Cengage’s strategy.” He noted that the announcement could cause other publishers to accelerate their OER strategies. “The movement is not going away,” he said.

    Rather than looking at this specific news in isolation, it would be helpful to put this in some historical context showing the interplay of the OER movement and changing strategies from the big textbook publishers. We advise a number of large and small publishers in our role as consultants, and they occasionally ask us to help them to better understand some of the points we’ve been making about OER in our posts over the years. Put another way, here comes a thread of historical e-Literate quotes.

    In response to a 2011 article in the Chronicle titled “Publishers Criticize Federal Investment in Open Educational Resources”, Michael (then an employee of Cengage) chastised his fellow textbook industry professsionals, writing:

    Many different open source-related business models have been tried with varying degrees of success. Some open source projects have become sustainable as pure volunteer efforts while others have needed commercial support.

    I see no reason to believe that open educational resources will be any different. Right now, we’re in the early days. It’s very hard to predict which sustainability models will work or who the winners and losers will be. But I think it’s reasonable to predict that, five years from now (a) there will still be for-profit textbook publishers (though their all-digital products probably won’t be called textbooks by then) and (b) most or all for-profit textbook publishers will be involved with the production, support, and/or distribution of OERs in some way or other. There will likely be some OER projects that will have achieved long-term sustainability without commercial support and others that will have achieved long-term sustainability because of commercial support.

    It’s more than six years later, but (a) note the burgeoning category of courseware, and (b) see Pearson, McGraw-Hill Education, and Cengage initiatives, among others. Put simply, it was apparent that publishers needed OER strategies at least as far back as 2011.

    Fast forward to 2014 when Michael had departed Cengage to enter the joyous world of market analysis and consulting, he offered the observation that many publishers actually like OER:

    For the most part, OER was just not something publishers thought a lot about.

    That has changed in US higher education as it has become clear that textbook profits are collapsing as student find more ways to avoid buying the new books. The traditional textbook business is clearly not viable in the long term, at least in that market, at least at the scale and margins that the bigger publishers are used to making. So these companies want to get out of the textbook business. A few of them will say that publicly, but many of them say it among themselves. They don’t want to be out of business. They just want to be out of the textbook business. They want to sell software and services that are related to educational content, like homework platforms or course redesign consulting services. But they know that somebody has to make the core curricular content in order to for them to “add value” around that content. As David Wiley puts it, content is infrastructure. Increasingly, textbook publishers are starting to think that maybe OER can be their infrastructure. This is why, for example, it makes sense for Wiley (the publisher, not the dude) to strike a licensing deal with OpenStax. They’re OK about not making a lot of money on the books as long as they can sell their WileyPlus software. Which, in turn, is why I think that Wiley (the dude, not the publisher) is not crazy at all when he predicts that “80% of all US general education courses will be using OER instead of publisher materials by 2018.” I won’t be as bold as he is to pick a number, but I think he could very well be directionally correct. I think many of the larger publishers hope to be winding down their traditional textbook businesses by 2018.

    This point is crucial, as OER is not just an opportunity to co-opt a movement but a potential strategy for publishers to solve an existential problem.

    In 2016 Cengage released a survey on OER adoption and attitudes, which to me signaled that they were getting quite serious about figuring out their strategy.

    According to [VP of Content Strategy] Costantini, the reason Cengage did this study is that in their view OER is another type of content, and there are high-level conversations at schools about adoption. Costantini described Cengage as making a move for a while to not be as proprietary, with the MindTap platform as an example where multiple content types – proprietary and OER – can be combined or used individually. Cengage views themselves as excellent curators, and OER content fits into this view. They want to accelerate this shift, and internally they need to better understand the dynamics of OER usage.

    By spring of 2017, Cengage put further meat on the OER bone with the release of a podcast series, where I noted:

    And this new podcast fits in the same mold. Cengage does not fully understand OER, but they seem to like it and see it as a way to help them out of a hole, and while they learn more, the company is sharing their learnings through surveys, resource pages, and podcasts.

    Given some mistakes in how the podcast was released, I suggested that Cengage learn and use David Wiley’s description of the 5 Rs of open (Retain, Reuse, Revise, Remix, Redistribute) in their material. ((Disclosure: David Wiley’s company Lumen Learning is a client of MindWires.)) With this historical context in mind, let’s turn back to the OpenNow announcement and the next stage of Cengage’s move into OER strategy.

    In an interview with Cheryl Constantini, she described how Cengage released MindTap ACE last year and learned some key lessons about OER. While many people want affordable solutions, the market feedback according to Cengage was that if you’re going to go OER, go all in with OER – mixing with proprietary doesn’t resonate. This led to OpenNow as a pure OER play, unlike MindTap ACE.
    Constantini also described the market feedback on the need for simplicity and that MindTap ACE had too many features. This led to the choice of using Learning Objects, a platform Cengage acquired in 2016, to be the base for OpenNow. The approach is to take OER standard textbooks, realign them as outcomes-based design along with associated assessments and added videos, and release everything with an open license. Nine of the 12 initial courses are from OpenStax, and three are re-licensed courses from Cengage now with CC-BY licenses. The videos use YouTube open licenses.
    For each course Constantini estimates that the modifications take $50k – $100k of internal work, including verifying of licenses for embedded elements. I would note a certain irony here in that OpenStax produces more-or-less traditional digital textbooks requiring publishers or OER services companies like Lumen to break apart and realign to competencies or outcomes.

    Cengage charges $25 per student per course for OpenNow.
    The assessments and instructor manuals raise a “burning issue” about whether they should be accessible by students or not. Initially Cengage is adopting the OpenStax pattern of licensing openly but controlling by passwords; however, this is a subject they need to think through and figure out over time.

    At the OpenEd conference last month, there was significant interest in the OpenNow presentation with people spilling over into the hallway. The movement of publishers into the OER space is real, and this release from Cengage should be viewed as part of a long-term shift in strategy. And one that attempts to fully embrace OER as seen by this interesting description:

    • High-quality, 100% OER narrative and assessment content from Cengage, OpenStax and other third-party sources.
    • CC-BY-licensed (5Rs), so instructors and institutions can adapt and reuse all narrative and assessment content as needed.

    Update: Added description of pricing model.

  • A Note on Data Used for LMS Market Analysis

    A Note on Data Used for LMS Market Analysis

    Recently Martin Dougiamas of Moodle has questioned our data analysis for the LMS market. In some useful notes posted at Moodle.com on two recent Future Trends Forums hosted by Bryan Alexander:

    Bryan finished the Future Trend Forum by asking for Martin’s thoughts on the recent article by Phil Hill titled: “Whither Moodle?” [edited] which speculated that Moodle’s growth is slowing down and hitting a plateau.

    Martin commented that is not the case from what he is seeing and that a lot of the information contained in the article is US-based where there a lot of more LMS vendors and venture capitalists building learning platforms.

    While this description from Martin is inaccurate, the issues raised are representative of some of the questions we occasionally get about our data for our LMS market analysis service. I think it would be useful to share a deeper description in public of how our partners at LISTedTECH collect and organize the underlying data.

    What We Measure

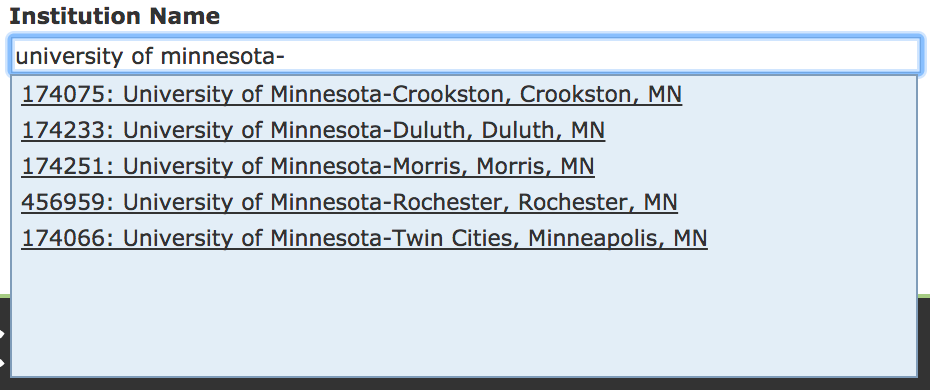
    The market data are organized in a dataset that captures system usage on a per higher education institution basis. For most schools, a campus is equivalent to an institution. But there are also cases where there multiple campuses per university (e.g. University of Minnesota system with five campuses, or DeVry University with dozens of campuses) and the LMS decision is made at the system level. In these situations, one decision will lead to multiple institutions listed in the data. In the US, the definition of an institution is guided by unique identifiers in the Department of Education’s IPEDS data, and each region or even country has its own way of defining institution.

    The dataset goes beyond “school X uses system Y”, as it also includes dates of implementation and decommission, usage as primary or secondary system (there may be more than one system in use at a school), and hyperlinks to the public information documenting a system selection or usage. The definition of institutions includes information about its sector (public two-year, private non-profit four-year, etc) as well as student enrollments.

    How We Measure

    Looking deeper at LMS selection, there are multiple layers of data gathering at different intervals. Some of the sources:

    • Extensive search engine notification such as Google Alerts on product keywords in multiple languages;
    • URL and domain scrapers looking for system information at official school websites; and
    • Targeted human-directed searches.

    Each new data point is verified by someone using the associated hyperlinks tied to selection or usage data.

    Our North American data is essentially saturated, in that we know the vast majority of degree-granting institutions based on US Department of Education data or Canadian provincial governmental data. We have well above 90% of all schools in the dataset.

    For the global regions outside of North America, we are building up the dataset and do not have saturated coverage yet. For example, in Europe we estimate that we have 60 – 75% of institutions. We have less than that in Latin America and more than that in Oceania.

    Where feasible, we include on-the-ground subjective coverage by visiting the global regions, testing theses, finding out unique context, and finding local sources who can provide QA to our data.

    Besides our home base of North America, we have made multiple trips to Europe and Latin America thus far, and we are currently arguing about who gets to visit Australia and New Zealand.

    We plan to expand coverage to additional regions as we develop at least 30% coverage of institutions and have time to do additional research to back up our analysis.

    Degrees of Uncertainty

    Because higher education data is lumpy and based on extended implementation times, we offer the following caveats:

    • Market share information provided in percentages and trends are more reliable than absolute counts outside of North America. When we do provide absolute numbers, we advise caution for readers or subscribers to not over-interpret the absolute numbers, at least without us providing additional details to keep the data in context.
    • We typically separate North American data from Rest of World data (Europe, Latin America, Oceania) to avoid problem of North America numbers dominating aggregates and obscuring important regional differences.
    • When we have system usage information but do not have accurate implementation dates (per month or quarter), we assign these system records to June. Therefore the summer data for new systems will appear artificially high. We currently have implementation dates for approximately 75% of the listed LMS records.
    • Put another way, annual data is more reliable (i.e. without additional data collection noise) than half-year or quarterly data. The more-granular data is provided to certain subscribers, but we take great care in attempting to describe sources of “lumpiness” in the data that should be understood for any analysis.

    Overall, we have LMS data for 4,523 institutions in the US and Canada and 8,824 institutions worldwide.

    Back to the Future (Trends)

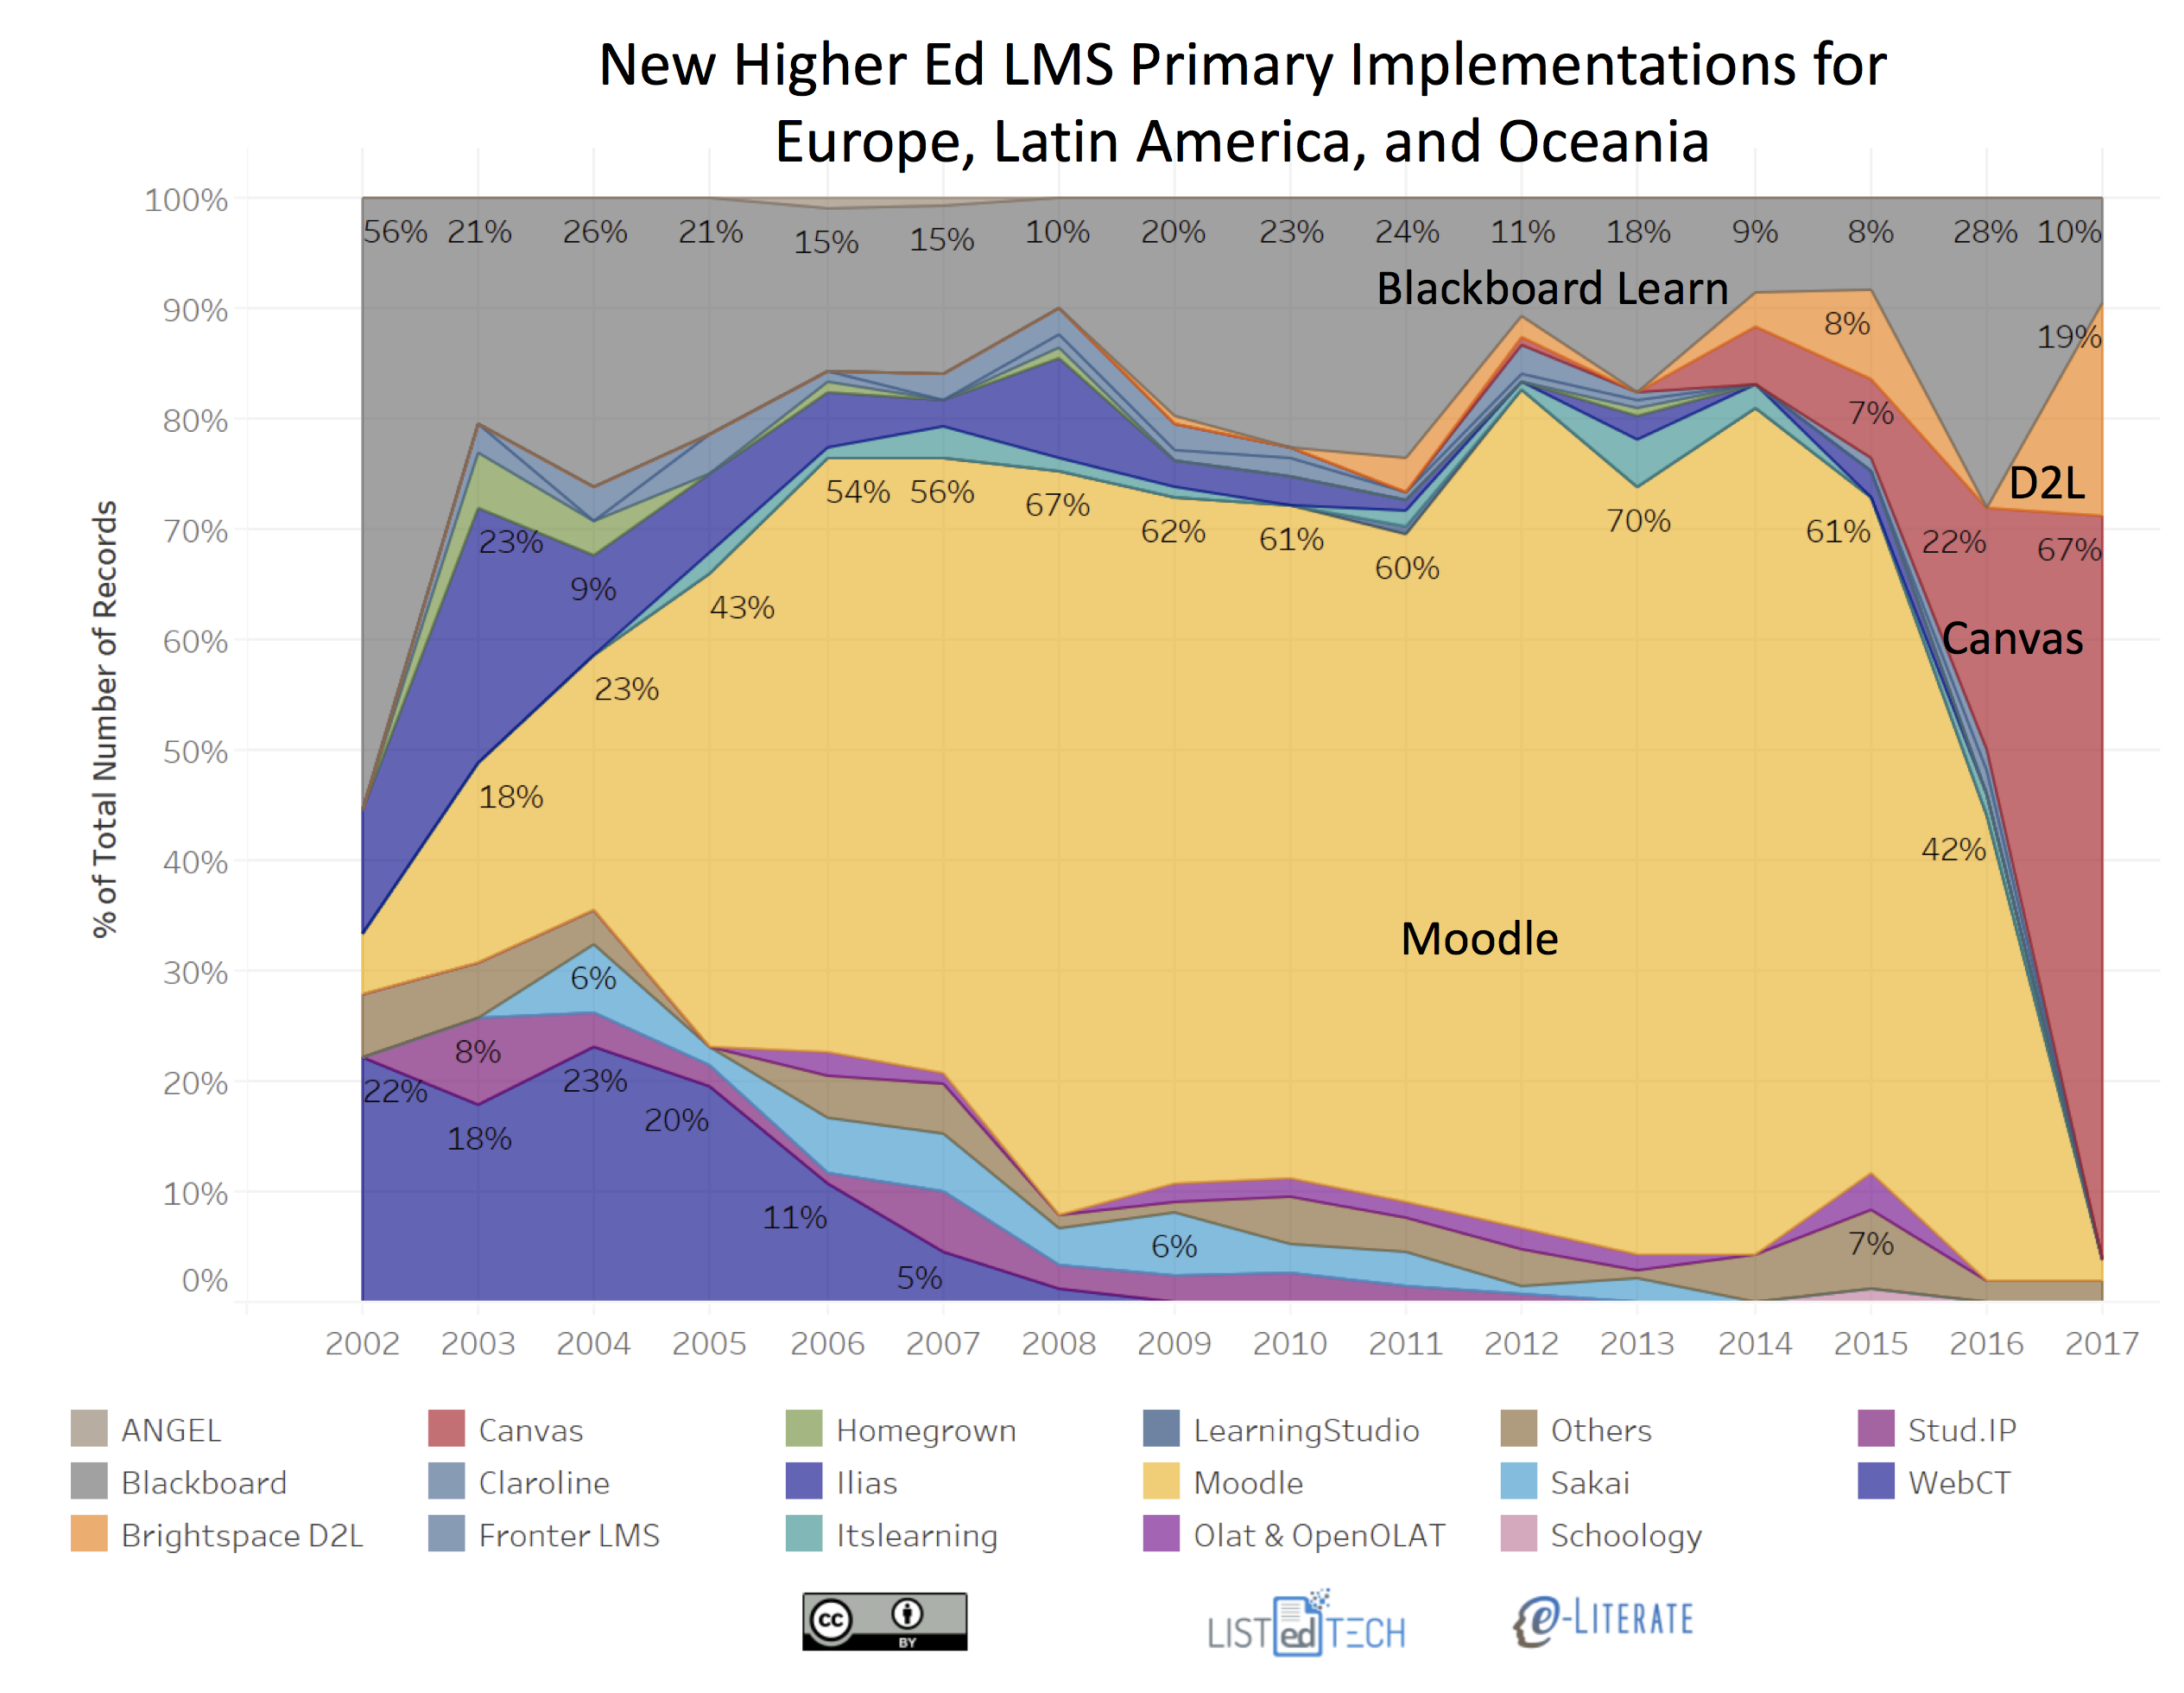
    To see these issues with an example, consider the updated chart of new implementations that led to the Future Trends Forum discussion described above.

    What is relevant to the dataset for this chart:

    • The data is based not on North American data – it is based on data from Europe, Latin America, and Oceania (Australia, New Zealand, and surrounding island countries).
    • The data comes from public sources per institution as described above and does not come from vendors;
    • The data is for primary systems – the official campus LMS; and
    • The caveats listed above should apply. Note that we identified a new trend early in 2017 (collapse of Moodle new implementations) that we can update with data through 10 months of the year – the data today is more solid than it was in early summer.

    I hope this description will answer some of the questions people have asked about our data.

  • State of Higher Ed LMS Market for US and Canada: Fall 2017 Edition

    State of Higher Ed LMS Market for US and Canada: Fall 2017 Edition

    Now that we’re past the 2017 WCET conference and headed to the EDUCAUSE conference, let’s look at updates on the institutional LMS market for North America (US and Canada). Last year we started our LMS market analysis service, where we are working with LISTedTECH to provide market data and visualizations, and our fall report for subscribers will be released in about a month. Data for 2017 presented below goes through October 1 of this year.

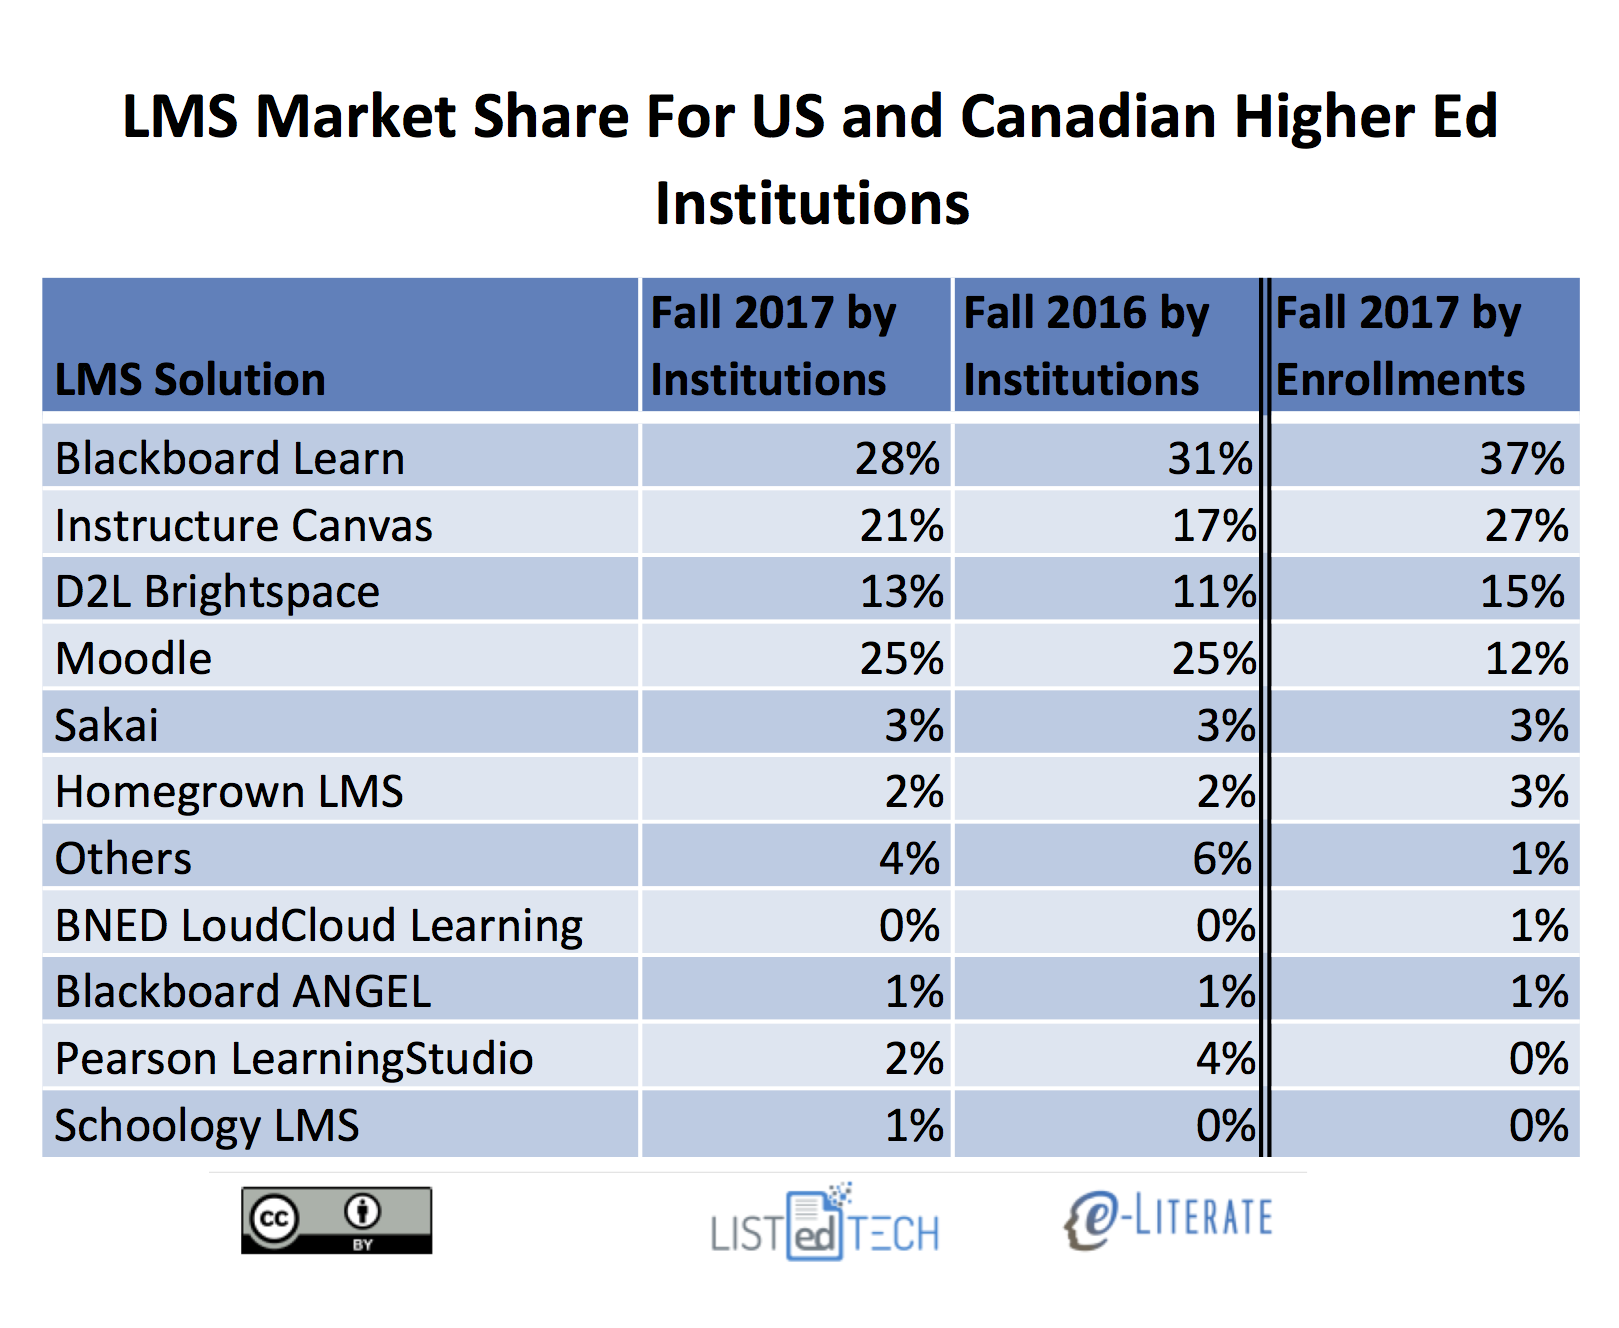
    We present the data “by institutions”, with market share as a percentage of the total number of institutions using each LMS as a primary system, and “by enrollments”, where we scale the institutions by their total enrollment. The latter better captures the business of the LMS market, since most licensing deals are based the number of students. We have also included data from Fall 2016 by institutions for comparison purposes.

    Some notes on the market share as defined by percentage of institutions:

    • In terms of new selections the market continues to be a two-horse race recently with Canvas by Instructure and Brightspace by D2L as the only two solutions with material gains in market share. Canvas grew from 17% to 21% , and Brightspace from 11% to 13%, of the market.
    • Outside of the big four – Blackboard Learn, Canvas, D2L Brightspace, and Moodle – no other system has more than 3% of the market measured either by percentage of institutions or percentage of enrollments. Furthermore, the category of “Others”, capturing systems not listed above and having less than 1% market share, actually dropped from 4% to 2% of the market. This indicates that continued market consolidation.
    • Schoology and BNED LoudCloud grew slightly, but not nearly to the degree of the Canvas and Brightspace.
    • Blackboard Learn fell the farthest, from 31% to 28% of of the market. The second biggest drop was Pearson LearningStudio, from 4% to 2%, based on its end-of-life notice for December 2017.
    • Moodle and Sakai both lost market share of just under 1%, not enough to show up in the rounded numbers in the table but enough to show up in our underlying data.
    • The difference in Moodle’s market share by institutions at 25% and by enrollments at 12% really shows how concentrated their usage is for smaller schools.
    • When viewing market share as defined by percentage of enrollments, Blackboard and Canvas are the most-used systems, at 37% and 27% of the market, followed by D2L at 15% and Moodle at 12%.

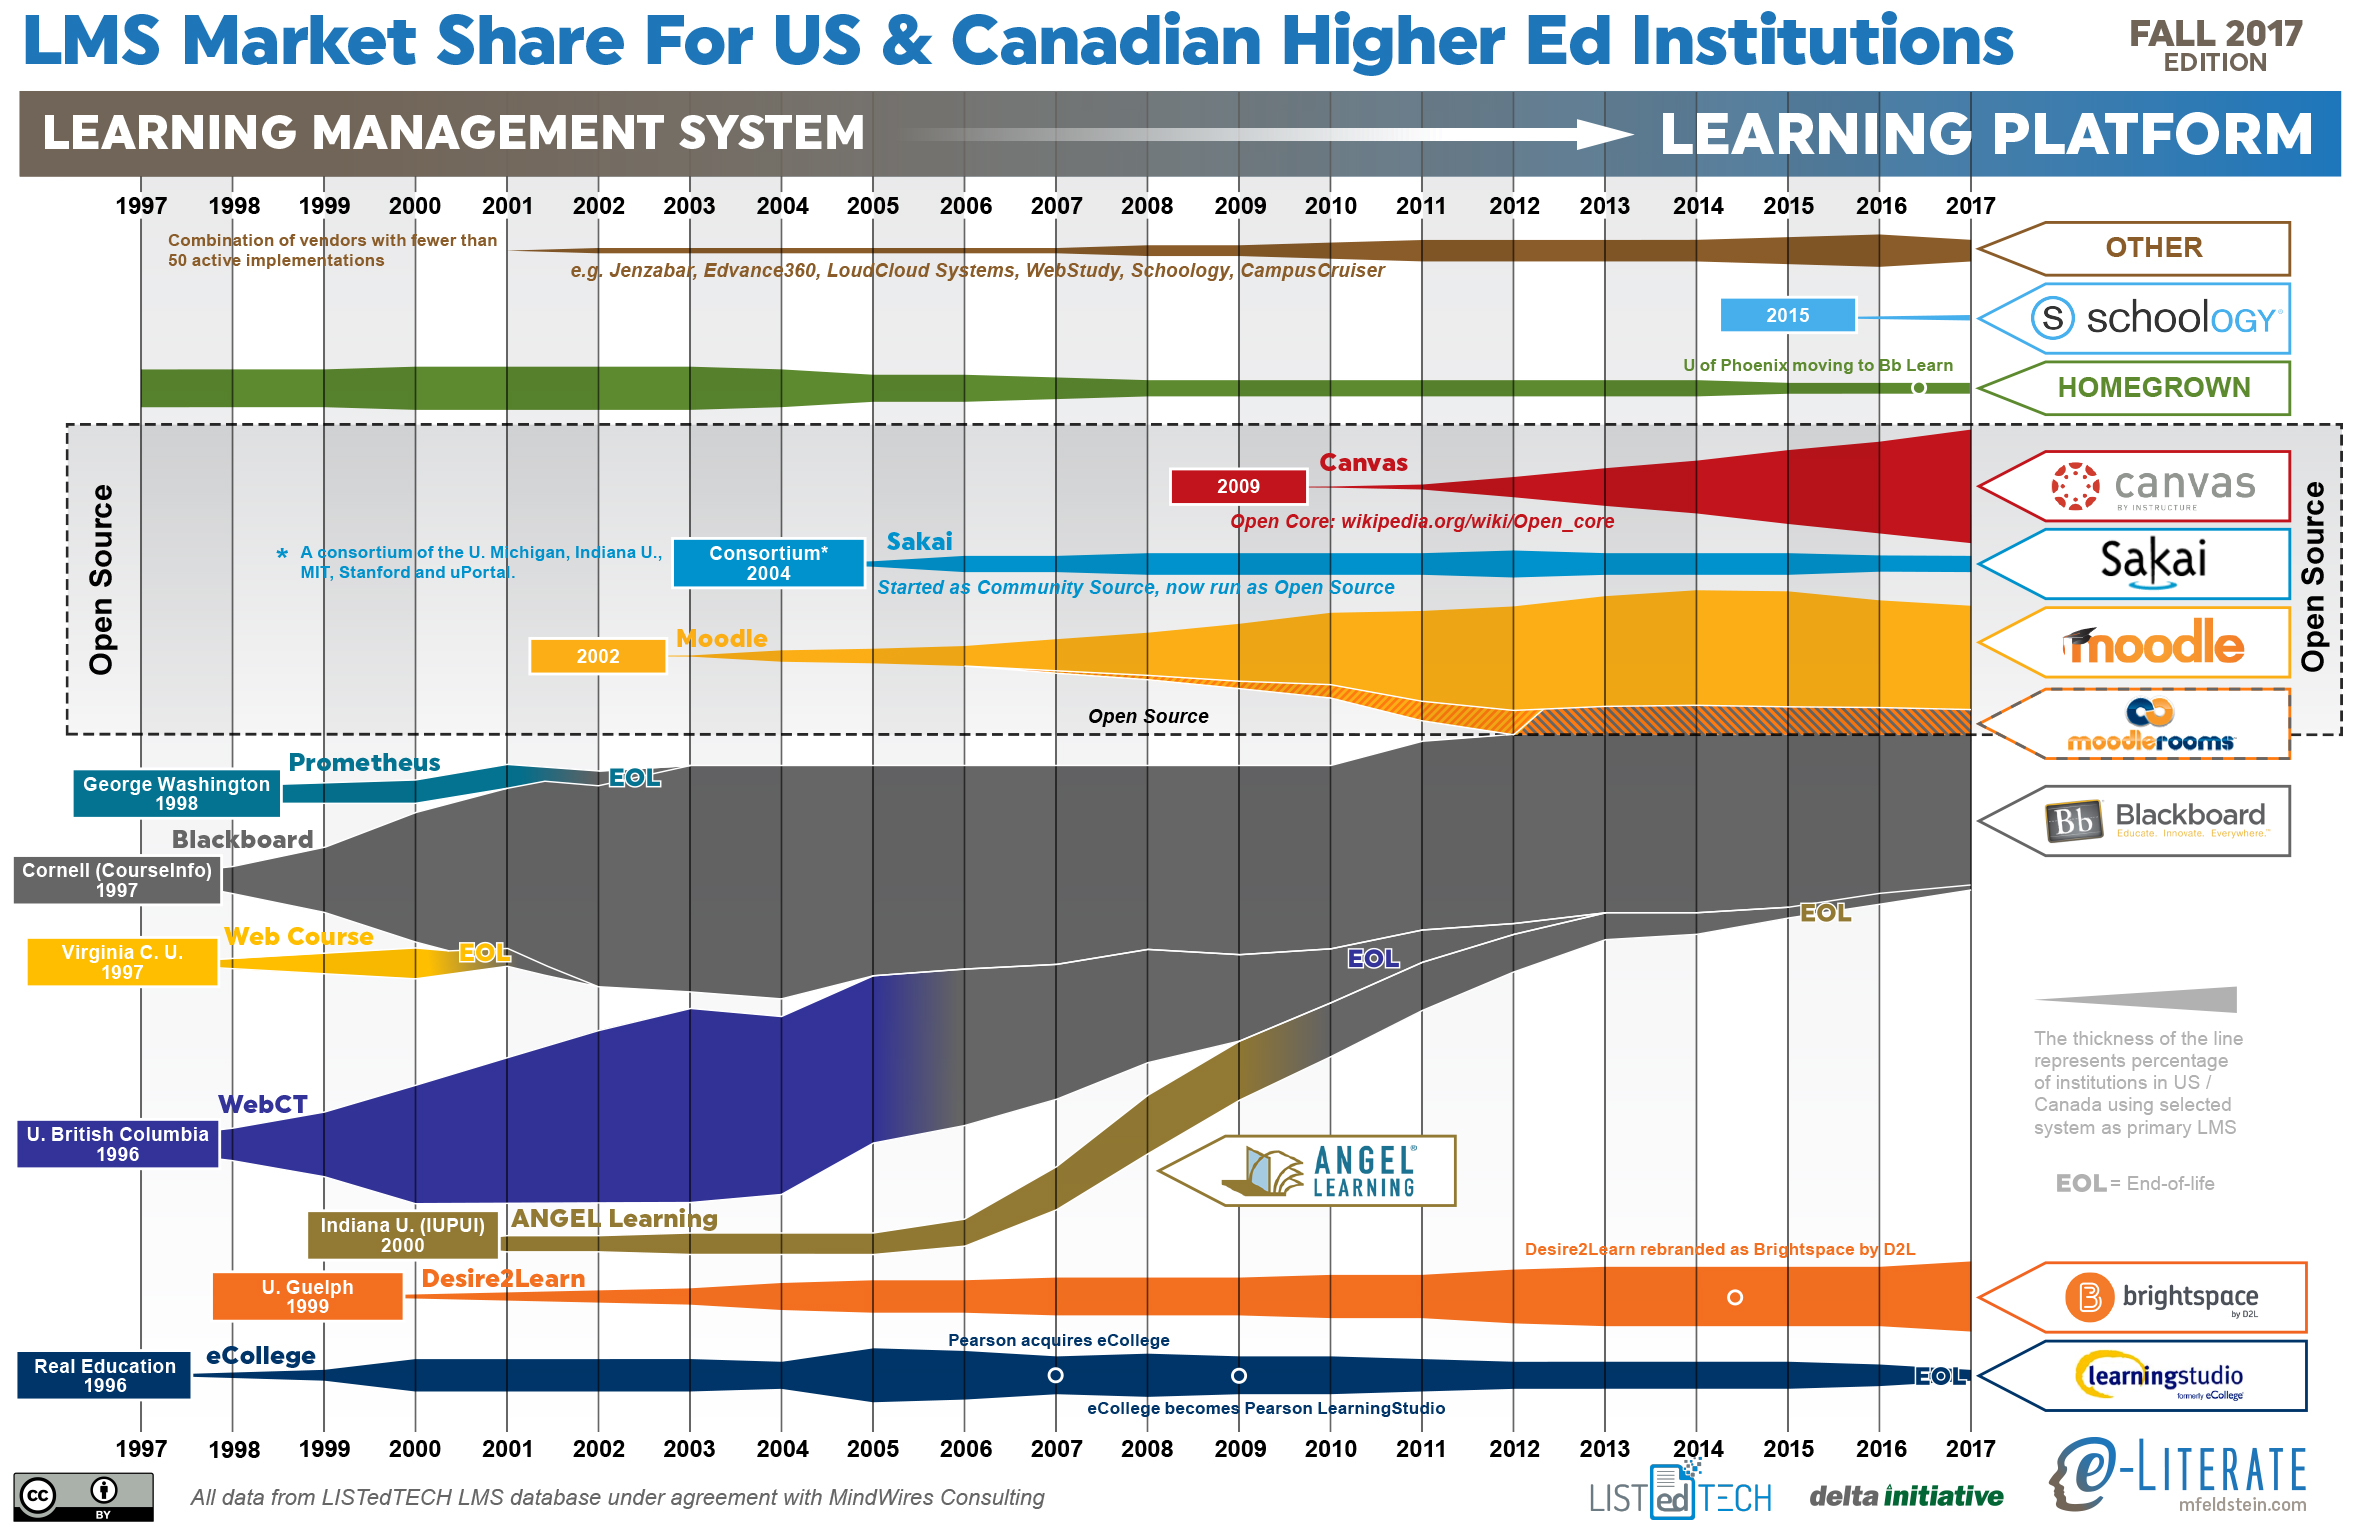
    Stepping back from the immediate data, let’s look at an updated LMS market share graphic, commonly known as the squid graphic, for US and Canadian higher education. The original idea remains – to give a picture of the LMS market in one page, highlighting the story of the market over time. The key to the graphic is that the width of each band represents the percentage of institutions using a particular LMS as its primary system.

    Some additional notes:

    • Blackboard and Moodle have been the market leaders as number one and two in share as they have been for the past decade. However, Canvas is quickly approaching Moodle’s market share.

    We’ll share any updates we discover at the conference this week.

  • WCET: Clarity into the successful transition of UF Online

    WCET: Clarity into the successful transition of UF Online

    At this year’s annual meeting for WCET, I was on a panel, along with EdSurge’s Jeff Young, moderated by Saint Leo University’s Jeff Borden. Kicking off the panel, Borden framed the discussion partially as learning from those outside academia. Even though I am not an academic, I have found myself making the mistake of a bias against outsiders. Almost two and a half years ago I described the emerging disaster of University of Florida Online (UF Online) – reality was exposing fundamentally flawed enrollment estimates based on institutional and vendor hubris. In this post I described another challenge:

    In the midst of the challenging startup, UF Online had to deal with the premature departure of the initial executive director. After a one-year search process, UF Online chose a new leader who has absolutely no experience in online education.

    That was probably the fifth edit of a paragraph that started closer to “UF Online somehow thought a bureaucrat from EPA should be its new leader. Next up: filling the VP of student support with DMV veteran.” I was wrong – it turns out that choosing an outsider was just what the program needed.

    Further down in the post I noted:

    At this point, it might have been worth stepping back and challenging some of the original assumptions.

    By late 2016, however, I noted a “remarkable transformation at UF Online” and how the unit shed the hubris of the initial plans and really did challenged original assumptions and came up with a new strategy.

    At another WCET session, this same UF Online executive director Evie Cummings provided more insight into the mindset that led to this transformation. Prior to coming to UF Online, Cummings was instrumental in creating and establishing the EPA Information Quality Guidelines and much of the focus was on transparency and accuracy of information shared with the public. This mindset has been brought to the University of Florida, not only leading to an honest reevaluation of original assumptions but also to what I consider exemplary public reporting on program and student outcomes at UF Online.

    Another mindset described in the session was the acceptance of those who control funding – board of governors and state legislators in this case – and figuring out how to use data and communication to bring them along into healthier decision-making.

    These approaches are evident in the UF Online annual report released earlier in the week.

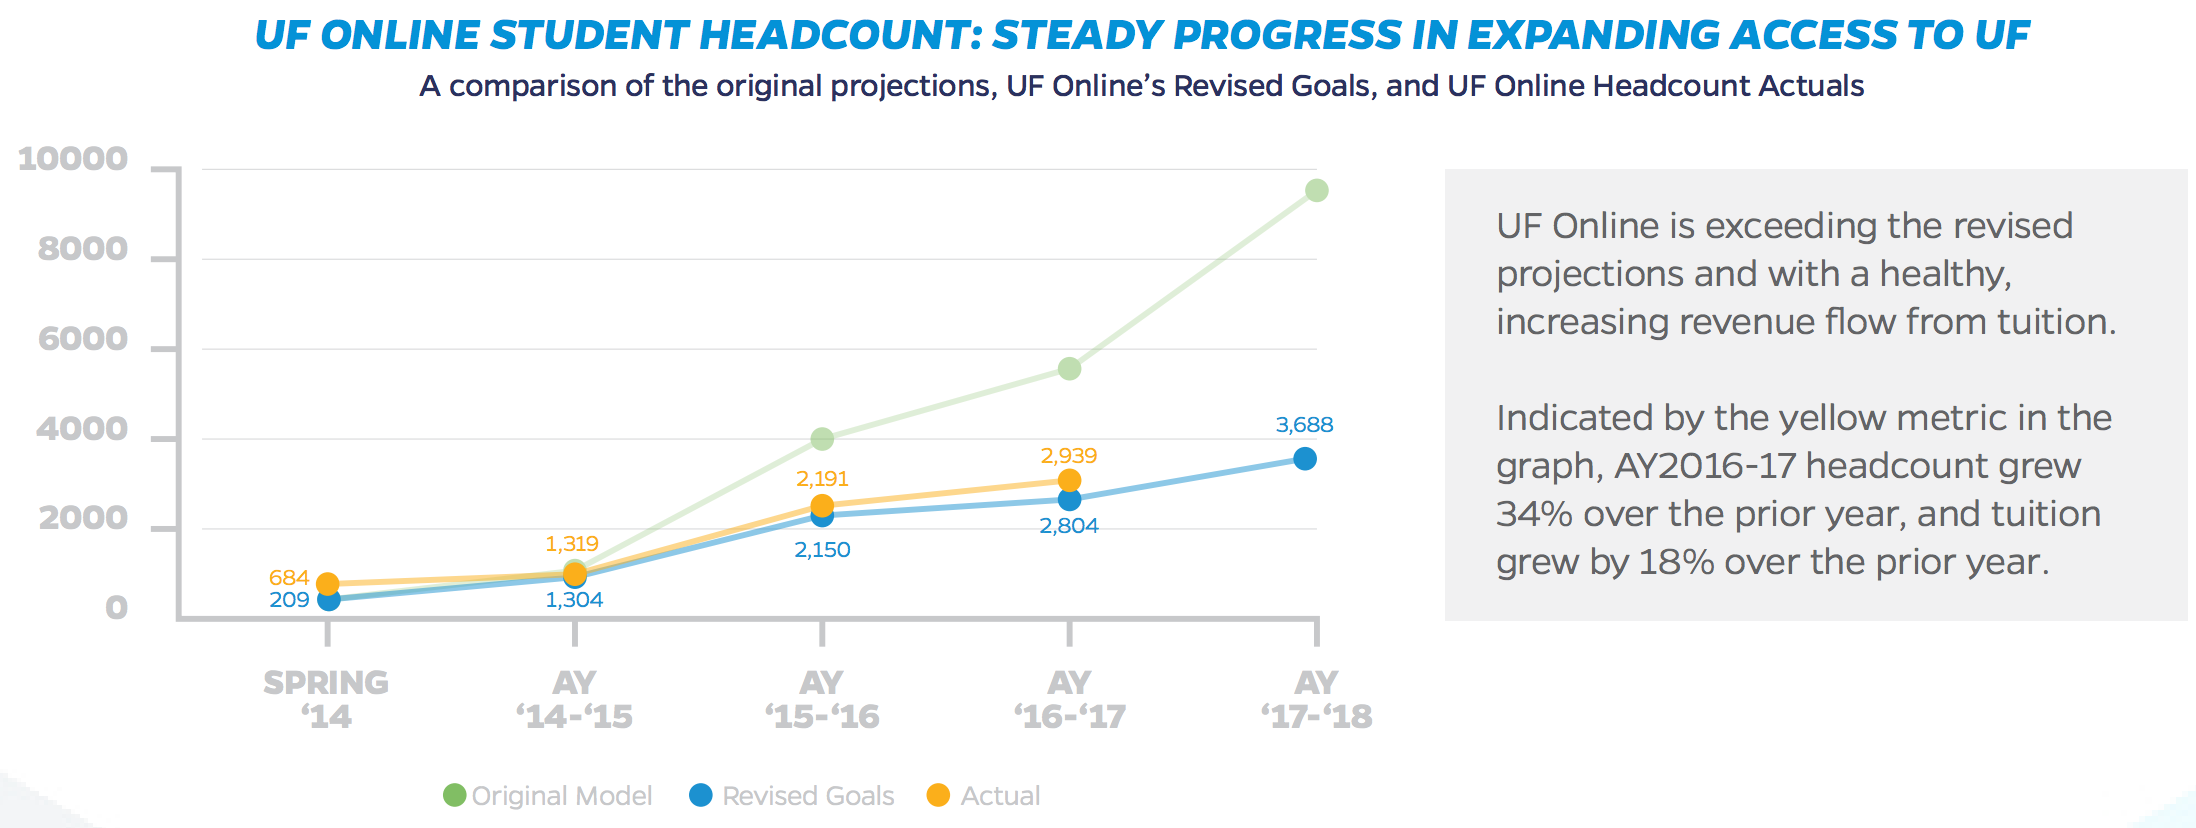
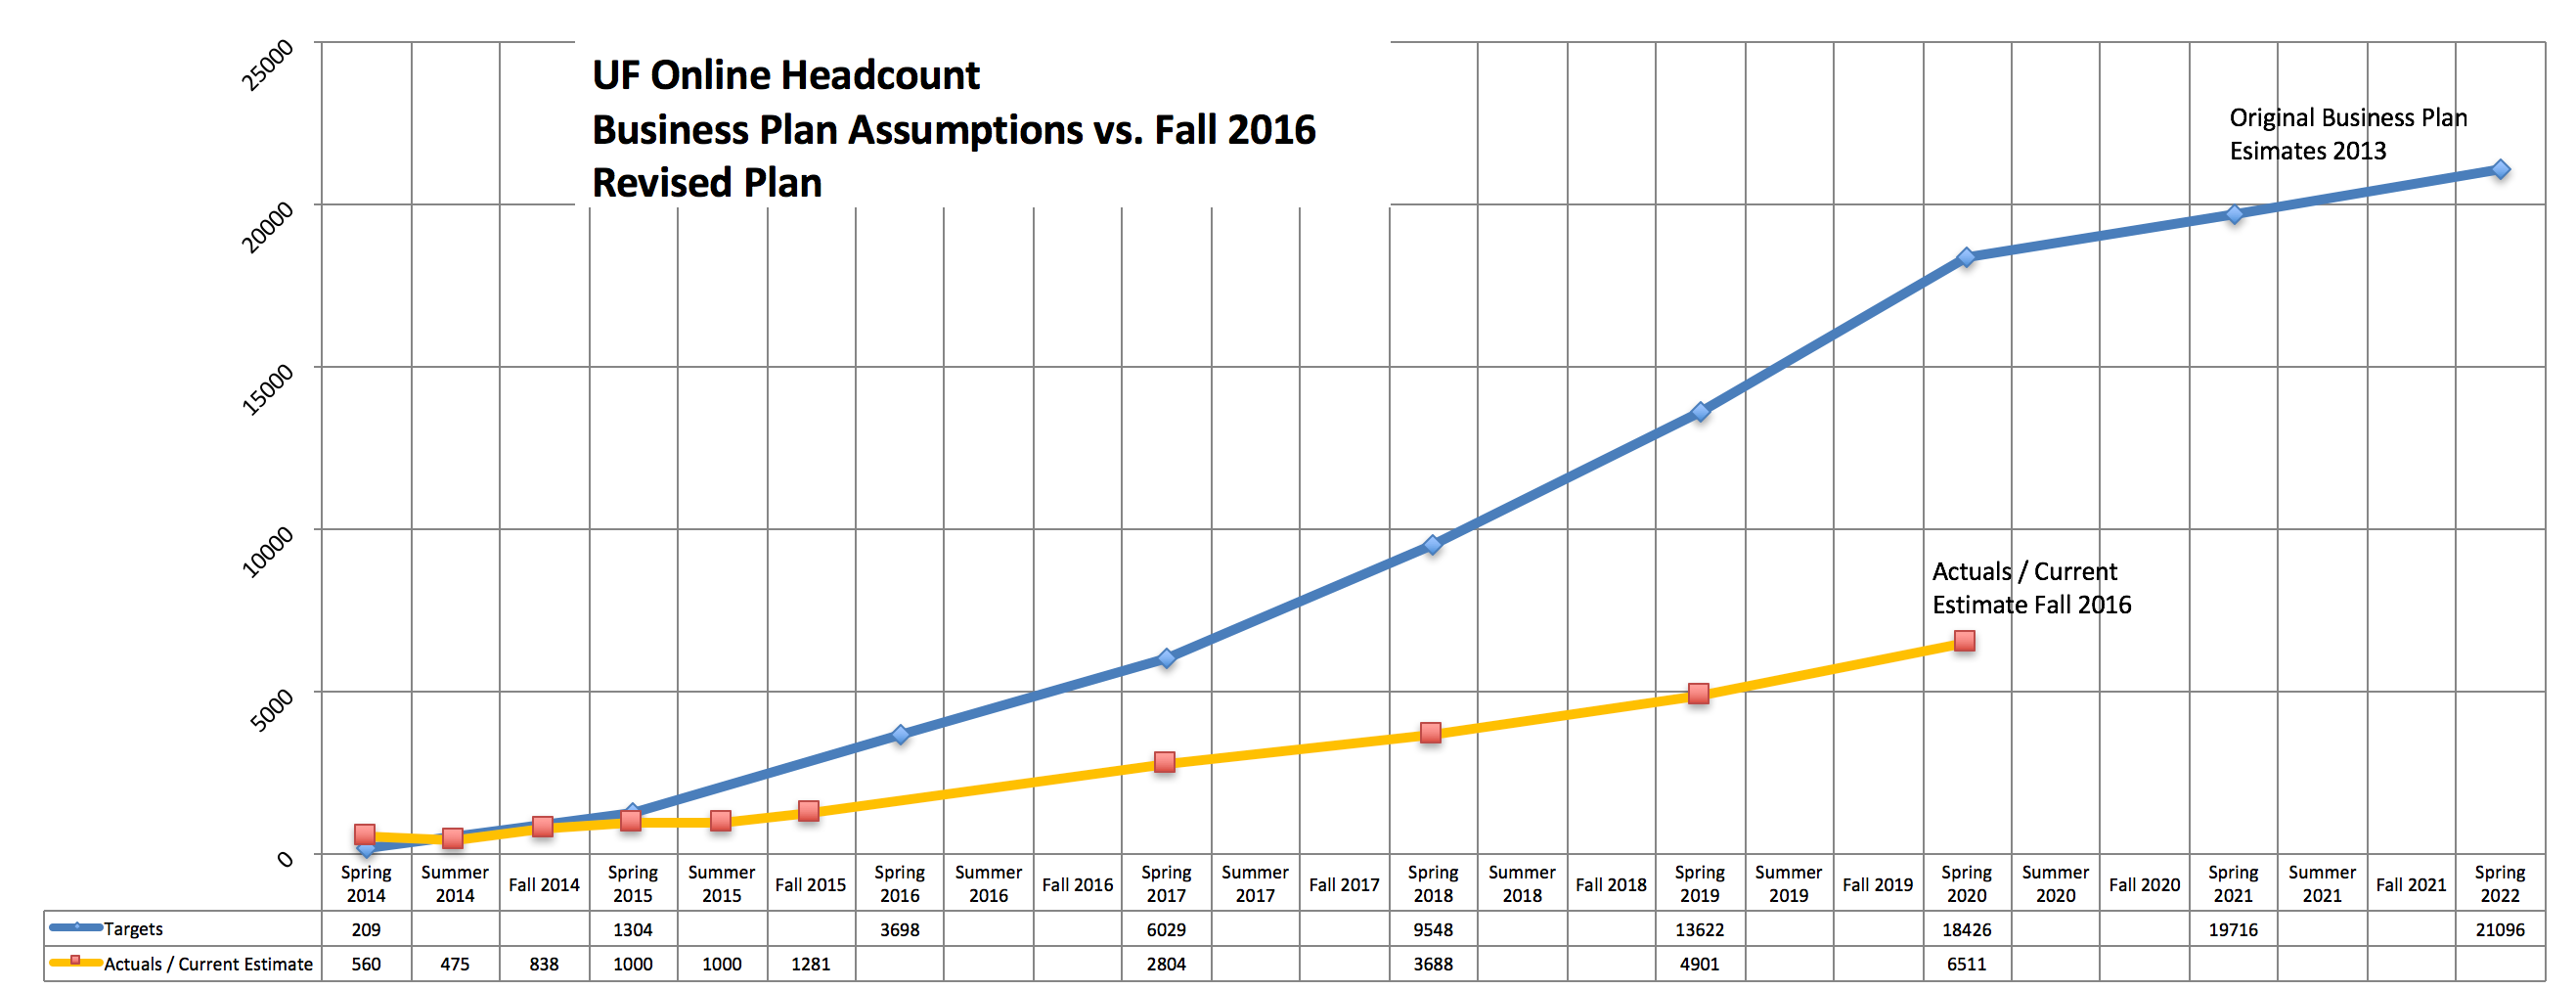
    In terms of enrollment, UF Online not only reports current status and plans, but they choose not to whitewash the past. Their report shows the original plan, the revised plan, and current results with a healthy 34% year-over-year enrollment growth.

    One side benefit – I no longer need to update the spreadsheet I had been using to describe the same information.

    Further in the report, there is a description of UF Online’s new emphasis on creating community among online students and graduates.

    Launched in 2017, the UF Online Connections Program works to foster a thriving learning community across all online students, faculty, academic advisors, and staff. Coupled with strong academic programs, a vibrant and engaged online student experience assures UF Online students not only gain the skills they need but also the connections and network to support them after they graduate. This past year, the Connections program emphasized providing community and networking opportunities with key strategic in-person events.

    They have also launched what they call UF Plaza, a virtual campus to help create social engagement, peer collaboration, and general support groups. Structures outside of the classroom focused on helping online students feel connected.

    One of my previous criticisms was the creation of Pathway to Campus Enrollment (PaCE) – automatic enrollment offers for qualified students who did not get into the main University of Florida as traditional students, with option to transition from online to campus for upper division coursework. When PaCE kicked off, the effort seemed focused mostly on institutional rather than student needs, and students were unprepared for the offer and decision. There was no provision to explain the program and help students decide if they should consider the online option.

    Now UF Online offers a mandatory PaCE Preview:

    This consists of a full day of informational sessions followed by one-on-one sessions with an advisor and concluding with first semester registration.

    They have also added remote site visits:

    We Come to You help sessions: For the first time, in March 2017, UF provided a local site visit in Coral Gables, FL to answer questions about PaCE and help students and their families to make an informed decision.

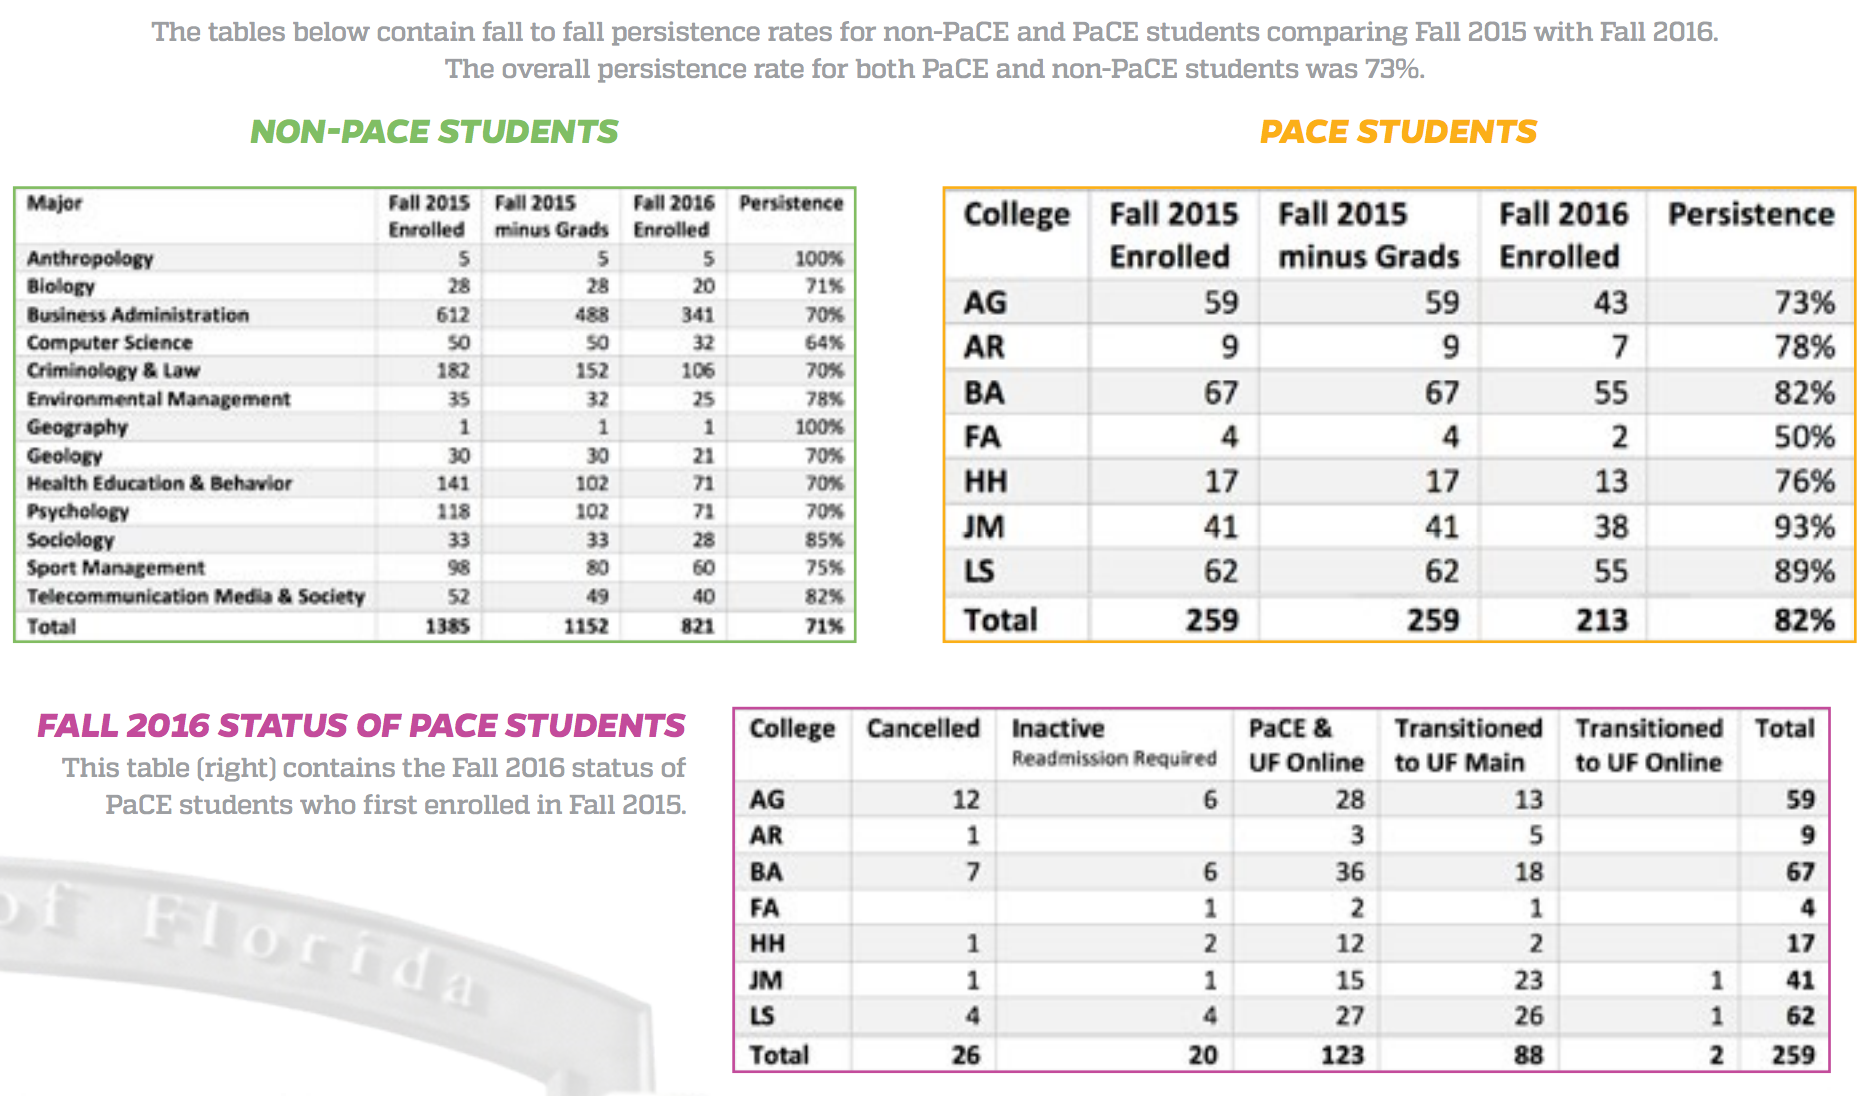
    Given that PaCE students are a different group – they did not initially apply to be an online student – it makes sense that UF Online now reports fall-to-fall persistence data for non-PaCE and PaCE student groups. And they even give a breakdown by academic program and updated status of the PaCE students who enrolled in 2015.

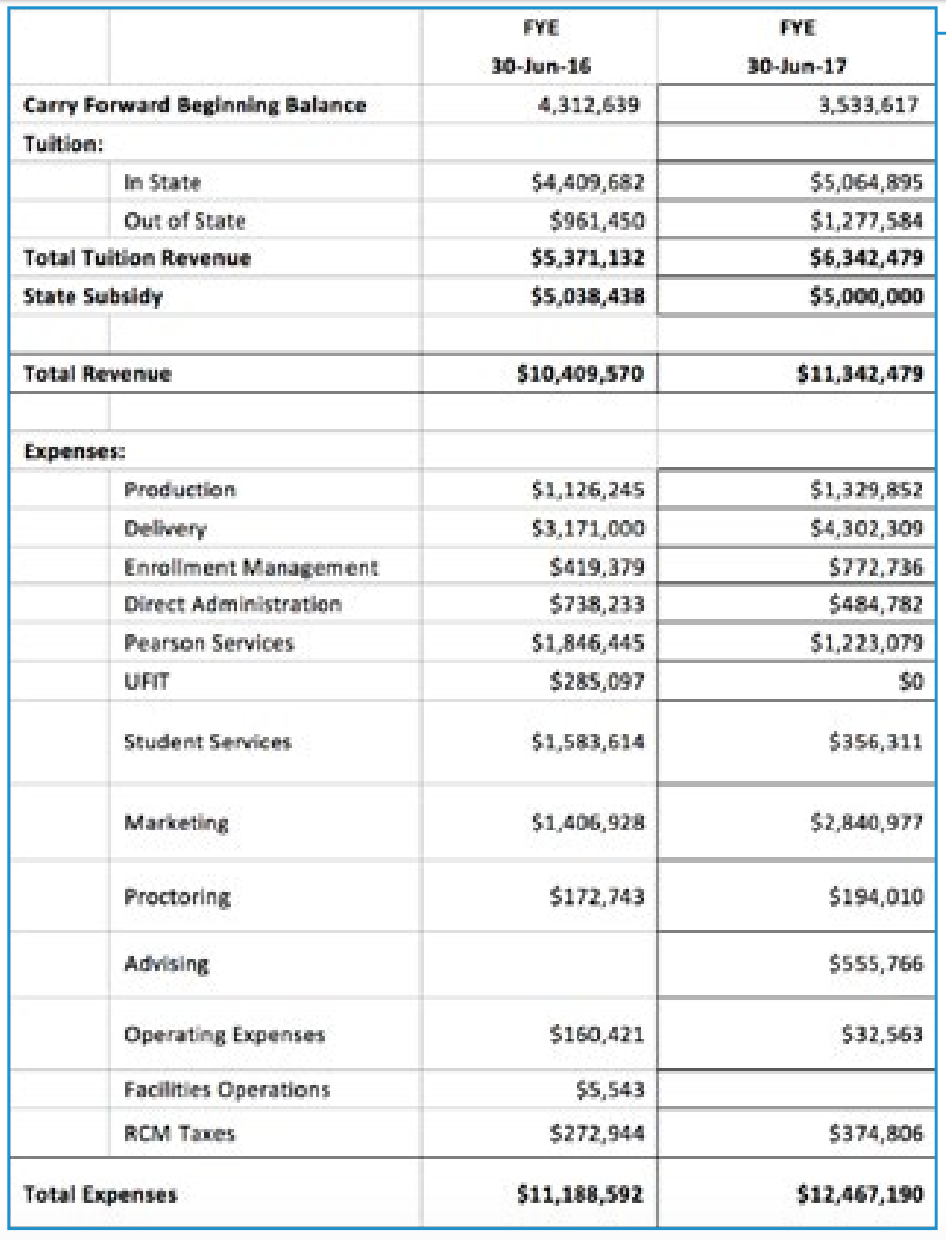
    There are also detailed financials, showing that UF Online is currently bringing in $6.3 m of tuition revenue and $5.0 m of state subsidies and spending $12.5 m.

    UF Online still has challenges – improving persistence rates, getting to break-even financials, etc. And they are not the only online program with this level of success. What makes UF Online so interesting to watch is that they made some hard choices to get past faulty original planning assumptions, they are very transparent in sharing their information publicly, and this is a very positive case of higher education embracing and learning from an outsider.

  • Unizin Membership Now Set As Annual Fee Of Up To $427.5k

    Unizin Membership Now Set As Annual Fee Of Up To $427.5k

    I’ve been meaning to provide an update on Unizin now that the consortium is three years old (started officially in July 2014). Thanks to public documents from the University of Minnesota, one of the 11 founding members, we now have additional clarity on the ongoing costs to remain a member of Unizin.

    Membership Fees

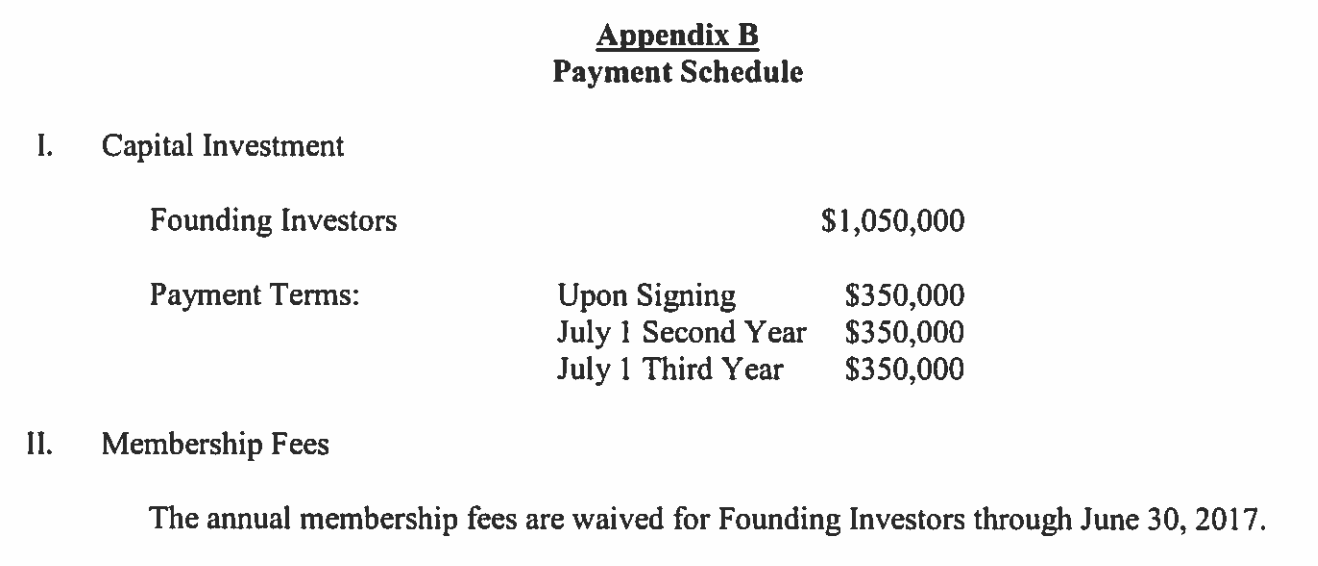
    For some background, Colorado State University staff back in April 2014 described the $1,050,000 initial fee in their meeting minutes for the University Technology Fee Advisory Board:

    3. Will this decrease overall costs on our end through collaboration?
    a. We are investing $1 million up front, but there is about a 7-year payback. We are investing in a $10 million product since the other 9 universities are putting their money in as we are too. This will absolutely decrease our costs.

    One year later, when the Florida State University System joined Unizin as associate members, we noted this item from the University of Florida / Unizin Consortium Membership Agreement:

    We noted at e-Literate in our article from 2015:

    Does this mean that founding institutions that “invested” $1.050 million over three years will have to start paying annual fees of $100,000 starting in June 2017? That’s my assumption, but I’m checking to see what this clause means and will share at e-Literate.

    Update (7/17): I talked to Amin Qazi today (CEO of Unizin) who let me know that the annual membership fee for institutional members (currently the 11 schools paying $1.050 million) has not be determined yet.

    Fast forward to 2017 and we have an answer. The University of Minnesota has to submit purchases over $1 million to its board of regents for consent, and at the July 2017 meeting the new Unizin membership fees were presented:

    To Unizin, Ltd. for $1,282,500 for a three-year renewal of membership in the higher education consortium for the Office of Information Technology (OIT) for the period July 1, 2017, through June 30, 2020. The annual payment of membership fees will be covered from OIT’s central O&M funds. The FY18 budget includes planning and funding for this expense.

    That equals $427,500 per year for the next three years for the 70,000+ enrollment university. What this now makes clear is that the up-front investment in Unizin was not a one-time fee broken up into three easy payments. Unizin member has an ongoing annual fee set in three-year periods.

    I again asked Amin Qazi for clarification, including whether all Unizin members were now paying the higher fee ($427.5k vs. $350k for initial three years). Amin confirmed via email:

    Unizin is a non-profit organization and seeks to cover its costs. We have found that our cost to provide our services and tools somewhat scale with the size of the institution. The Unizin Founding Member Fees have been adjusted after the initial three year period. So while larger institutions do pay more, smaller institutions pay less. We anticipate further adjustments as we grow and are able to recognize even greater economies of scale.

    I would then assume that the University of Minnesota, along with University of Michigan and Penn State University, are paying at the highest level and more than $350k, and that smaller schools like the University of Iowa and the University of Nebraska are paying less than $350k.

    LMS Fees

    The same University of Minnesota document also describes their costs for the Canvas ((Disclosure: Instructure is a subscriber to our market analysis service.)) LMS based on the Unizin agreement.

    To Unizin, Ltd. for $5,023,000 for a purchase of Canvas Learning Management System (LMS) for the Office of Information Technology (OIT) for the period July 1, 2017 through June 30, 2022. [snip]

    Unizen [sic], on behalf of its member institutions, conducted a competitive Request for Proposal followed by a detailed evaluation process. Through this process Canvas by Instructure was selected as a Learning Management System (LMS). The University then conducted a two year pilot of Canvas and a majority of the stakeholders preferred Canvas to the University’s current LMS, Moodle. Most of the Big Ten schools have adopted or are adopting Canvas.

    The University receives an additional 30% discount by purchasing Canvas through Unizen [sic] rather than purchasing directly through Infrastructure [sic] and 3% caps on annual increases, rather than 5%, has been negotiated.

    This five-year deal comes out to $12 – $14 per student per year. The document does not specify what level of support they have chosen, although they describe a “dedicated test server”.

    New Associate Members

    In other news, Unizin announced in July that the University of Nebraska system has joined as associate members.

    The Unizin Consortium is thrilled to welcome the full University of Nebraska system, bringing the total number of institutions in the consortium to 25. With the addition, the University of Nebraska at Kearney, University of Nebraska at Omaha, and University of Nebraska Medical Center join Unizin Founding Member the University of Nebraska Lincoln.

    Note that associate members do not pay the same amount as full members. In Florida, the State University System deal costs each associate member $100k per year.

    We’ll likely give updates at e-Literate after the EDUCAUSE conference on how Unizin has evolved in terms of services and potential new members. But for now we at least have more clarity on the financial terms of the consortium.

  • University of Wisconsin System to Migrate From D2L Brightspace to Canvas LMS

    University of Wisconsin System to Migrate From D2L Brightspace to Canvas LMS

    In one of the most significant LMS selection projects of the past few years, the University of Wisconsin System (UWS) has chosen to migrate from D2L’s Brightspace to Canvas as its centrally-supported Learning Management System (LMS). ((Disclosure: UWS, UW Madison, Instructure, and D2L are all subscribers to our market analysis service, and we aided UWS in the needs analysis portion of this project.)) UW Madison already moved to Canvas as part of its Unizin membership, but now the rest of the 180,000 student, 26 campus system will also make the change.

    The decision was first noted on the UWS procurement portal and in a investor analysis note from Raymond James. A representative from UWS confirmed the news and added that “Canvas has been issued the Notice of Intent to Award and a final contract is going to the UW System Board of Regents for formal approval in October”.

    The UWS project page describes the process leading up to the LMS selection, starting with needs analysis kickoff in 2015.

    The Learning Environment Needs Analysis (LENA) project was undertaken as a continuation of a multi-year UW System effort to: 1) understand the current and future learning technology landscape, 2) uncover the wants and needs of UW System institutions with regard to academic technologies that support teaching and learning, and 3) identify gaps that exist in supporting teaching and learning through academic technology. The results of the LENA project were presented to the Learn@UW Executive Committee, along with a recommendation that the Committee charter the process for planning to move into a next generation learning environment for the UW System. The intention was that through this process, UW System would discover potential paths forward to support such an environment.

    Last year UWS developed the request for proposal (RFP) requirements list, and the formal RFP was released in January of 2017.

    Beyond the size of the system, UWS decision is significant due to it being the first major customer of Desire2Learn (as the company was known prior to 2014). Back in 2002 / 2003, most LMS decisions were framed as Blackboard vs. WebCT, and when UWS selected little-known D2L, it sent shock waves through the market. The decision really put D2L on the map as a true contender, and they followed up with wins at the University of Iowa ((Disclosure: In previous consulting company I advised U Iowa on their LMS selection.)), the Ohio State University, Minnesota State Colleges and Universities, and the University System of Georgia.

    We have noted several times at e-Literate and as part of the e-Literate Big Picture: LMS market analysis service that D2L has an impressive record of client retention. The company has been a fierce competitor in keeping customers, as seen when the Colorado Community College System recently chose to remain on D2L Brightspace after their LMS selection process. ((Disclosure: CCCS is a subscriber to our market analysis service. I also advised CCCS when they originally chose D2L in 2008.)) This loss of UWS is the biggest setback for the company in terms of losing clients, and it is a major win for Instructure’s Canvas system.

    Expect more market news to come out in the next month based on WCET and ECUCAUSE conferences.