e-Literate

Present is Prologue

Author: Phil Hill

  • Google Classroom: Isolated adoptions for higher education institutions

    At last month’s Future Trends Forum hosted by Bryan Alexander, I received several questions around the intersection of K-12 and higher education markets for learning platforms. A condensed version of my answer is that the mainline LMS vendors are seeing increased overlap (Canvas, D2L Brightspace, Blackboard, Moodle, and Schoology in particular), but that there was little overlap when it comes to the teacher-oriented Big Classrooms (Google and Facebook).

    Three years ago when the buzz over Google Classroom was at its peak, I wrote several posts looking at the platform, ultimately concluding in the post titled “Why Google Classroom won’t affect institutional LMS market … yet”:

    None of this argues that Google Classroom is an inferior tool – it is just not designed to replace the full-featured LMS. Remember that Google is a technology-vision company that is comfortable putting out new tools before they understand how the tools will be used. Google is also comfortable playing the long game, getting more and more instructors and faculty using, giving feedback, and pushing forward the new toolset. This process will take some time to play out – at least 2 or 3 years in my opinion before a full institutional LMS may be available. If Google like the direction Classroom usage is going.

    Subsequently, Google has addressed some of the gaps in the product, including a programming interface that could allow deeper integration with student record systems used at higher ed institutions.

    We’re now 3 years down the road from the initial analysis – has Google Classroom started to be adopted as a full institutional LMS?

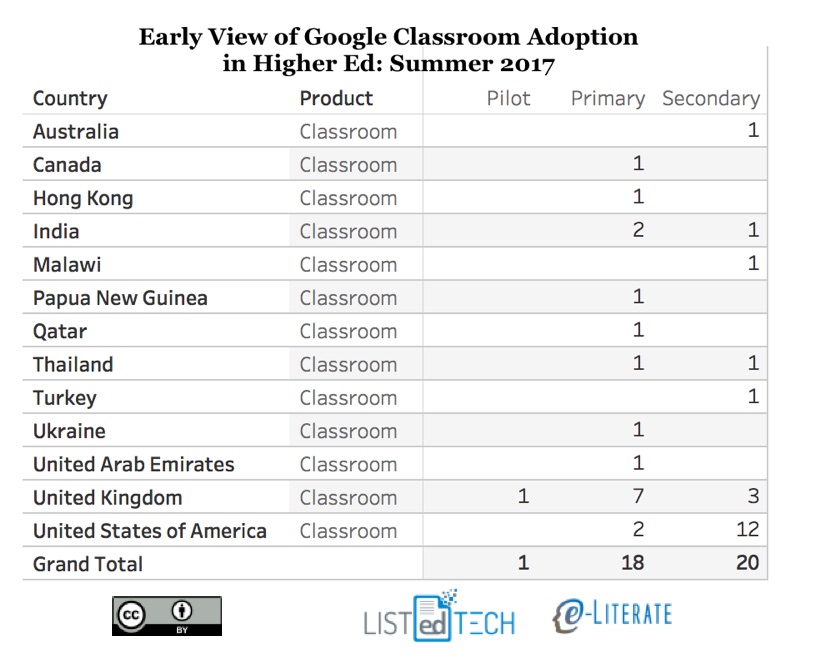
    Our partners at LISTedTECH have performed an initial analysis on this question. We do not yet have full data coverage in the same fashion as our LMS market analysis, but this early view should give some insight into higher ed adoption of the platform.

    For this initial view, we are looking at institutional adoption. Where a school supports Google Classroom as their primary or secondary system. There are plenty of other cases where individual faculty choose to use the platform in an unsupported manner.

    Notes from initial view:

    • A lot of the interest seems to come from developing countries where the education budgets are quite low. Malawi, Papau New Guinea, etc.
    • For the United Kingdom, the number is artificially high as 5 of the institutions are all part of Warwickshire College Group (a collection of Further Education colleges). Nevertheless, the UK has the higher number (so far) of institutional adoptions.
    • The usage of Google Classroom as a secondary system makes sense – an alternative platform that doesn’t have all the features and integrations typically needed for primary system usage – but there are cases now of primary usage.
    • In the US, the most notable adoption is the California University of Management and Sciences, a Student and Exchange Visitor Program (SEVP)–certified institution in Anaheim. They support both Moodle and Google Classroom for primary LMS usage.
    • While we don’t have comprehensive coverage yet, it appears that there are some isolated cases of Google Classroom institutional adoption in higher education. The platform is still not a true LMS competitor, but we’ll keep watching.
  • Academic LMS Market Share By Enrollments, Part Deux

    Academic LMS Market Share By Enrollments, Part Deux

    Based on our recent publication of market share data and graphics, we have had multiple requests to share similar data by enrollment. In Friday’s post I shared a non-traditional view of the LMS market based on the percentage of institutions within small, medium, and large enrollment bands for North America (US and Canada) and Europe. This view gave some interesting insights, particularly with large positive correlation (Canvas) and negative correlation (Moodle)  between enrollment bands and market share in North America. Meanwhile, there were other LMS solutions (D2L and Sakai in particular) that have fairly consistent distribution in market share.

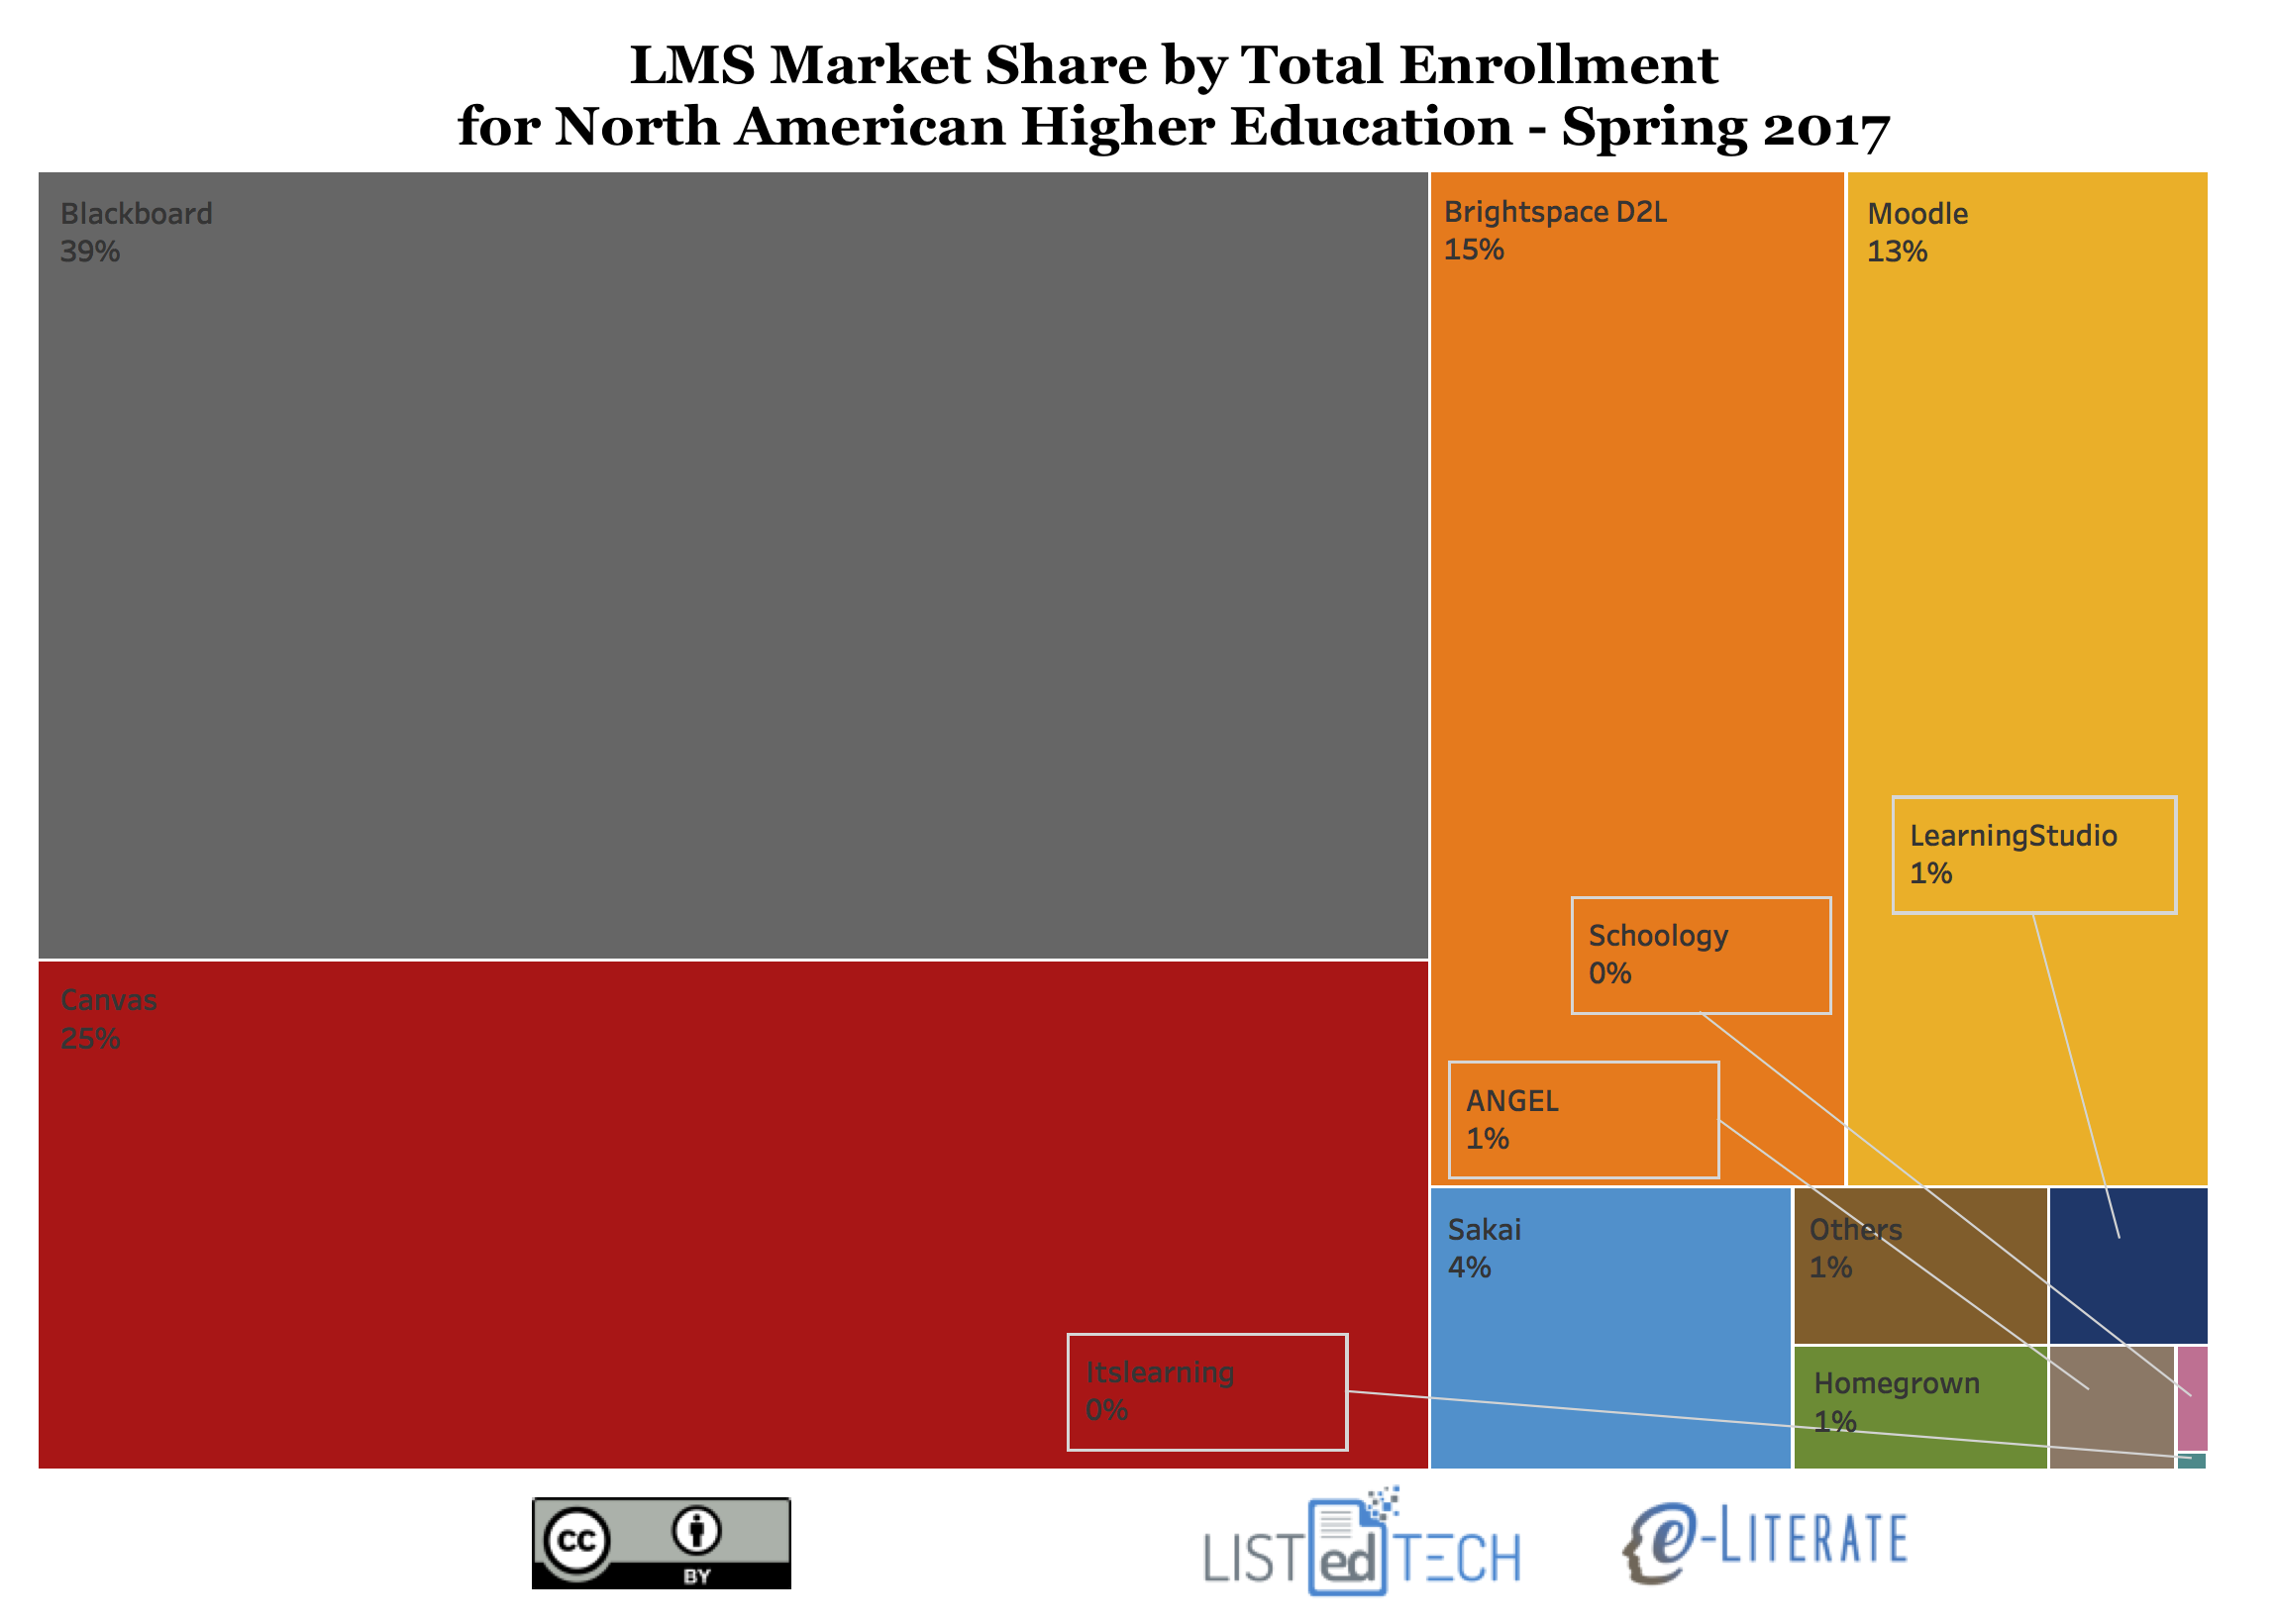
    For this second view, instead of showing percentage of institutions within each enrollment band, the data is aggregated for all North American institutions and scaled by each institution’s official enrollment data (e.g. the US data is from IPEDS). The net result shows the percentage of enrollments across the region that have different LMS solutions as their primary system at their school. As always, the underlying data for these market share studies is provided by our partner LISTedTECH.

    Some Notes:

    • For North American Higher Education, Blackboard Learn at 39% is still in first place, Canvas is second at 25%, D2L Brightspace is third at 15%, Moodle is fourth at 13%, and Sakai is fifth at 4%.
    • It has been widely reported when just looking at percentages of institutions that Moodle has long been the second most-used system in North America, but in this view both Canvas and D2L Brightspace have a larger market share.

    It is useful to look at different views using institutional and enrollment metrics to get a deeper understanding of the academic LMS market dynamics.

  • Academic LMS Market Share By Enrollments, Part I

    Since the earliest days of Campus Computing and EDUCAUSE measurement of LMS market data up through recent analysis by Edutechnica and LISTedTECH (the latter our partners for the LMS market analysis service and data behind our LMS graphics), the most common measurement used has been “number of institutions adopting system X as their primary LMS”. But that is only one view, and like any view it has limitations. Sweet Briar College with 900 students is treated with the same metric as Ohio State University with 55,000. I’m sorry, The Ohio State University.

    Based on our recent publication of market share data and graphics, we have had multiple requests to share similar data by enrollment. Both Edutechnica and LISTedTECH have provided such views here and there in the past, but given our recent analysis expansion along with LISTedTECH to cover non-North American regions, we thought it would be worth sharing LMS market data based on enrollments.

    What we cannot do is look at how many students actually use the LMS. But for North America (US and Canada in this case) and Europe, we have sufficient coverage of official enrollment figures that we can scale each institution by its enrollment data. This is how most LMS companies determine their prices for each school, so it is a much better measurement to correlate with market revenues. Not a perfect measure, but a better one.

    In addition, this view gives additional insights into the market and likely future direction of the LMS providers.

    Hey Phil, will you just get to the damn graphics? Let us judge the importance.

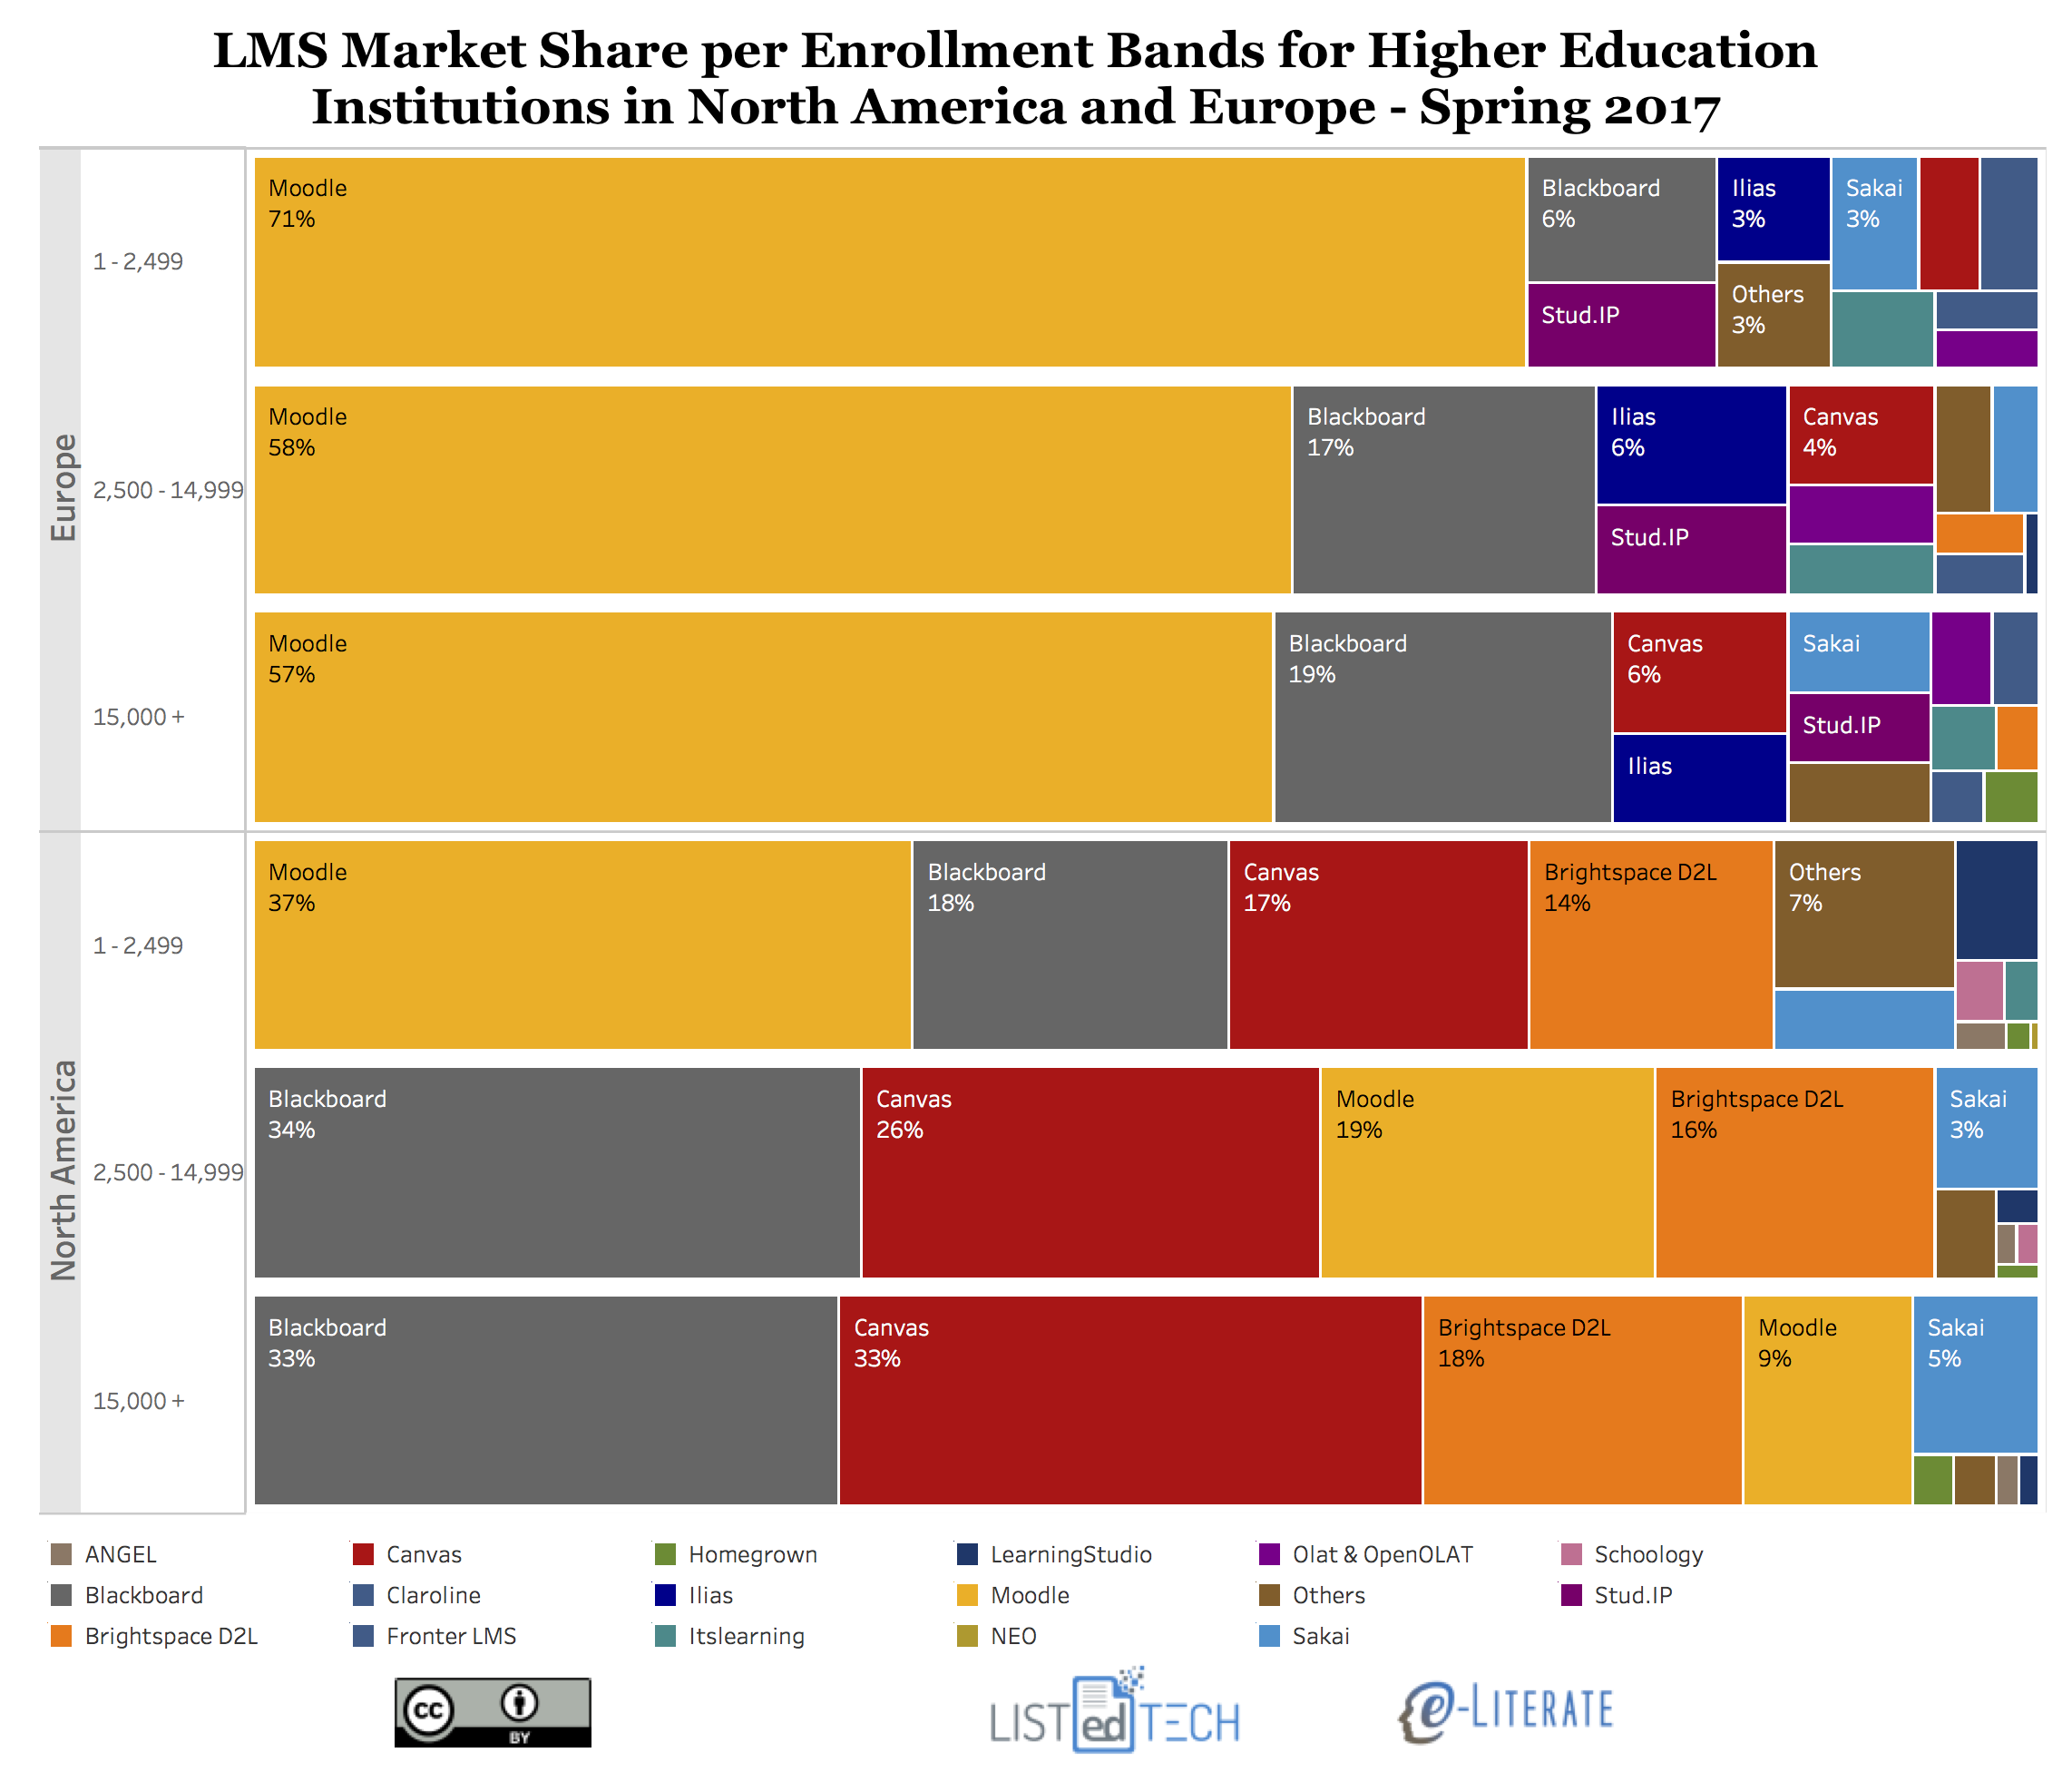
    OK, OK – for our first view, we group all institutions into separate bands of total enrollment and show market share for each band for each region (North America and Europe). Percentage of institutions adopting each LMS within each enrollment band of Small (1 – 2,499), Medium (2,500 – 14,999) and Large (15,000+) enrollments. Update: Clarified language.

    Some Notes:

    • The LMS with the greatest enrollment variation is Moodle, particularly in North America. For small schools below 2,500 students, Moodle is #1 at 37%, but for medium schools it’s #3 at 19% and for large it’s #4 at 9%. A huge difference. In Europe, Moodle market share also inversely correlates with enrollment but to a far smaller degree (71%, 58%, 57%) and it is still #1 in all bands.
    • Blackboard Learn and Canvas vary in North America the opposite direction – larger enrollment sizes equals larger market share – but not quite as dramatically as Moodle’s inverse relationship. Blackboard is #1 with roughly 33% market share for both large and medium institutions but is #2 with 18% for small institutions. Canvas goes from 33% for large to 26% for medium to 17% for small institutions. And note that Canvas and Blackboard Learn are virtually tied for first place for large institutions in North America.
    • D2L Brightspace has the most even distribution, with 18% of large, 16% of medium, and 14% of small institutions. That’s interesting.
    • In Europe, the overall distributions are more consistent with less variation between enrollment bands. While Moodle has smaller market share for larger enrollment bands, the general shape of the market does not change that much – just scaled a bit and with minor variations.
    • In what might be a surprise given its roots in larger research universities, Sakai (like D2L) has a fairly even distribution and similar market share across small, medium and large institutional bands.

    Coming soon – combining data not in enrollment bands but as scaled by each institution’s enrollment numbers.

    Update: See second post here.

  • Enrollment Implications Regarding Directive for Online Community College in California

    A month ago Governor Jerry Brown directed Eloy Oakley, Chancellor of the California Community College System (CCCS) ((Disclosure: The Online Education Initiative from CCCS is a client of MindWires. The views in this and future posts represents my independent views and not OEI’s.)) to “take whatever steps are necessary” to establish a fully-online college. At first glance this directive appears to be a solution in search of a problem, so it is worth looking beyond the headline see what is motivating this move.

    In an article from Community College Daily:

    Noting that the system has significantly expanded the number of online courses, Brown said, “I believe it is time now for our community colleges to increase even further the availability of online courses and degree programs – and make college far more accessible and affordable.”

    Reaching more students

    “The governor has been interested in realizing the promise of online education for a number of years,” Oakley said in an interview with CCDaily. He added that Brown also wants a way to reach more nontraditional students.

    “We have literally tens of thousands of working adults with some college and no credentials and a couple of million working adults who are unemployed or underemployed,” Oakley said. “This is a wonderful opportunity to reach a population that really needs a community college to achieve economic mobility.”

    The details are not yet worked out, and Oakley is pulling together a group to advise on the options available to make this directive a reality, with the recommendations due in November. Oakley’s comments clearly establish access for nontraditional students to be the ultimate driver. In an interview with Inside Higher Ed, Oakley commented further:

    “Part of this is the governor’s desire to reach more students in California through a technology platform,” said Eloy Ortiz Oakley, chancellor of the California Community College system. “The 114 campuses are designed in a traditional manner, so we’re reaching a traditional population that is students coming out of high schools.”

    But a new online-only college could reach students those traditional brick-and-mortar campuses are currently missing — adults who are unemployed or underemployed, he said.

    To achieve these goals of reaching more working adult students, there are some real challenges to address.

    View of CCCS Enrollment Mix

    It is worth viewing the historical headcount numbers available from the Chancellor’s office, focusing on age group to get a better understanding of the status quo.

    The headcount for CCCS peaked in 2009 at 2.93 million students and has since dropped to the current 2.36 million level, a reduction of 19%. Across the state, colleges are looking for ways to increase, or at least slow the decrease, in overall enrollment.

    What is most striking in the data, however, is the shift from older students (age 25 and above, or “adults”) to younger students (age 24 and blow, or “traditional”) for the community college system, with the mix roughly reversed from 25 years ago. Chancellor Oakley and Governor Brown are right to note that the older student population is not being served well, at least if we use actual enrollment as a proxy. And the situation is getting worse, not better. However, while the majority of students in CCCS are 24 or younger, there are also a large number of older adult students. In other words, there appears to be an overlap between the students in the current 114 colleges and the target students for the new fully-online college. This will present quite a challenge for Oakley and other planners to make the following statement from the IHE interview a reality.

    “We don’t want to cannibalize the system, and we wouldn’t want to create a college to take enrollment from other colleges,” Oakley said. “Any solution would have to complement what we do, and it has to have an opportunity to share revenue with the colleges and really enhance their ability to serve students.”

    This statement is sounds good on paper and will be crucial in terms of getting at least tacit support from the current colleges to the creation of a new, full-online college. But the data shows there is not a clear and easy path to serve adult, non-traditional students without affecting existing colleges.

    National Trends

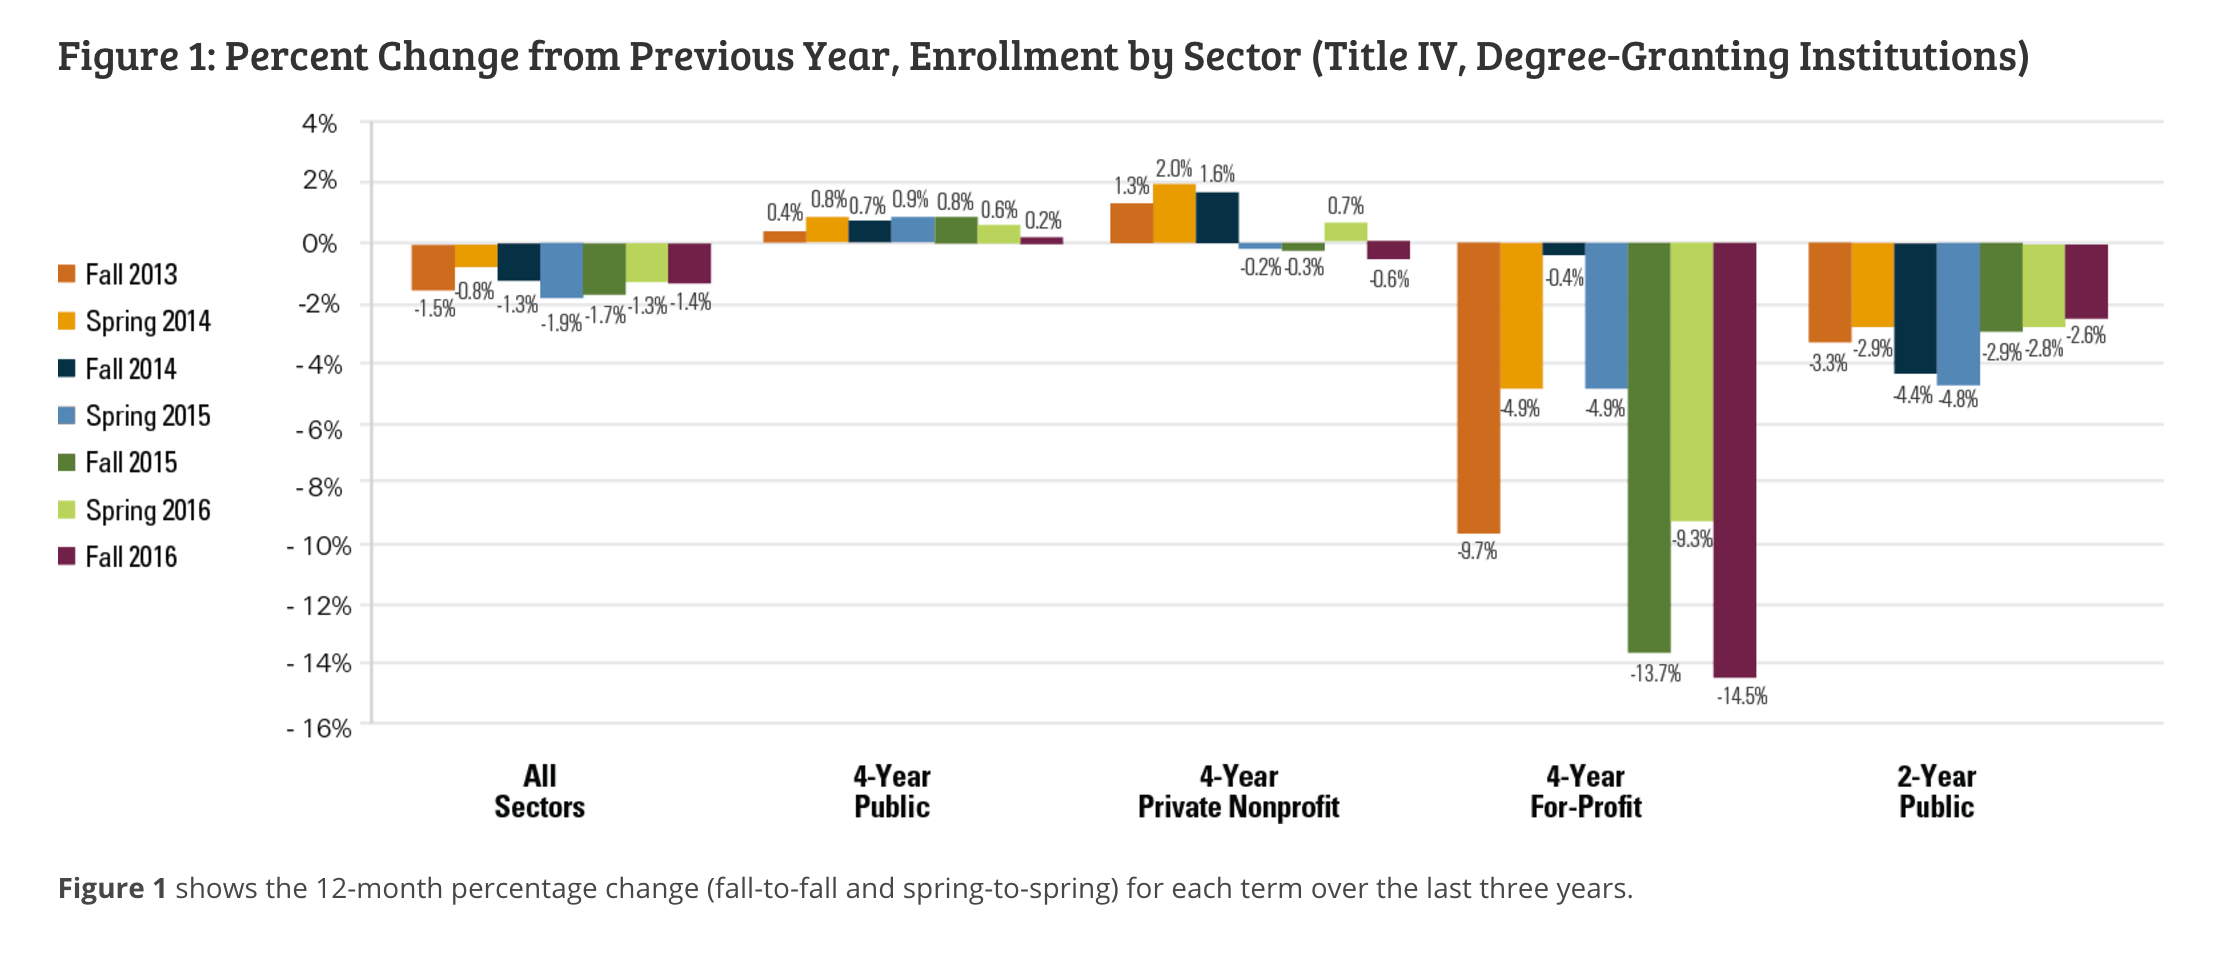
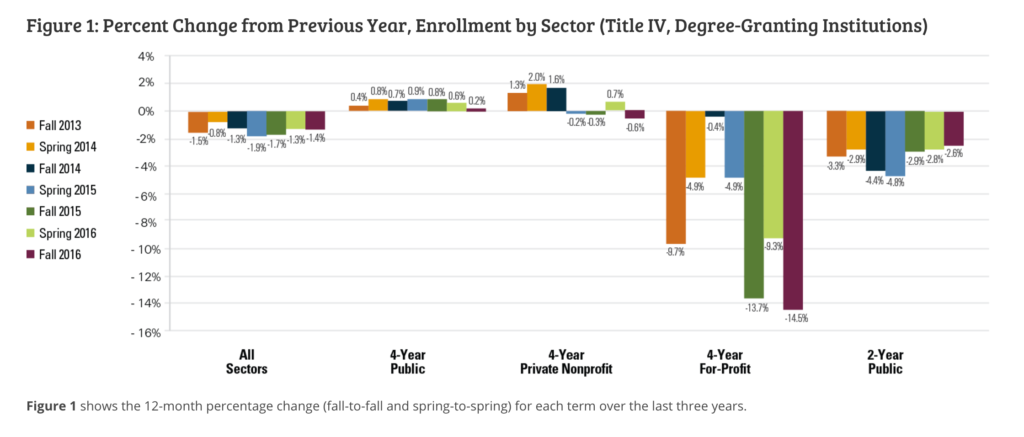
    In this situation California is not alone. The National Student Clearinghouse research for Fall 2016 shows first that community college (2-year public) enrollments have been dropping nationwide.
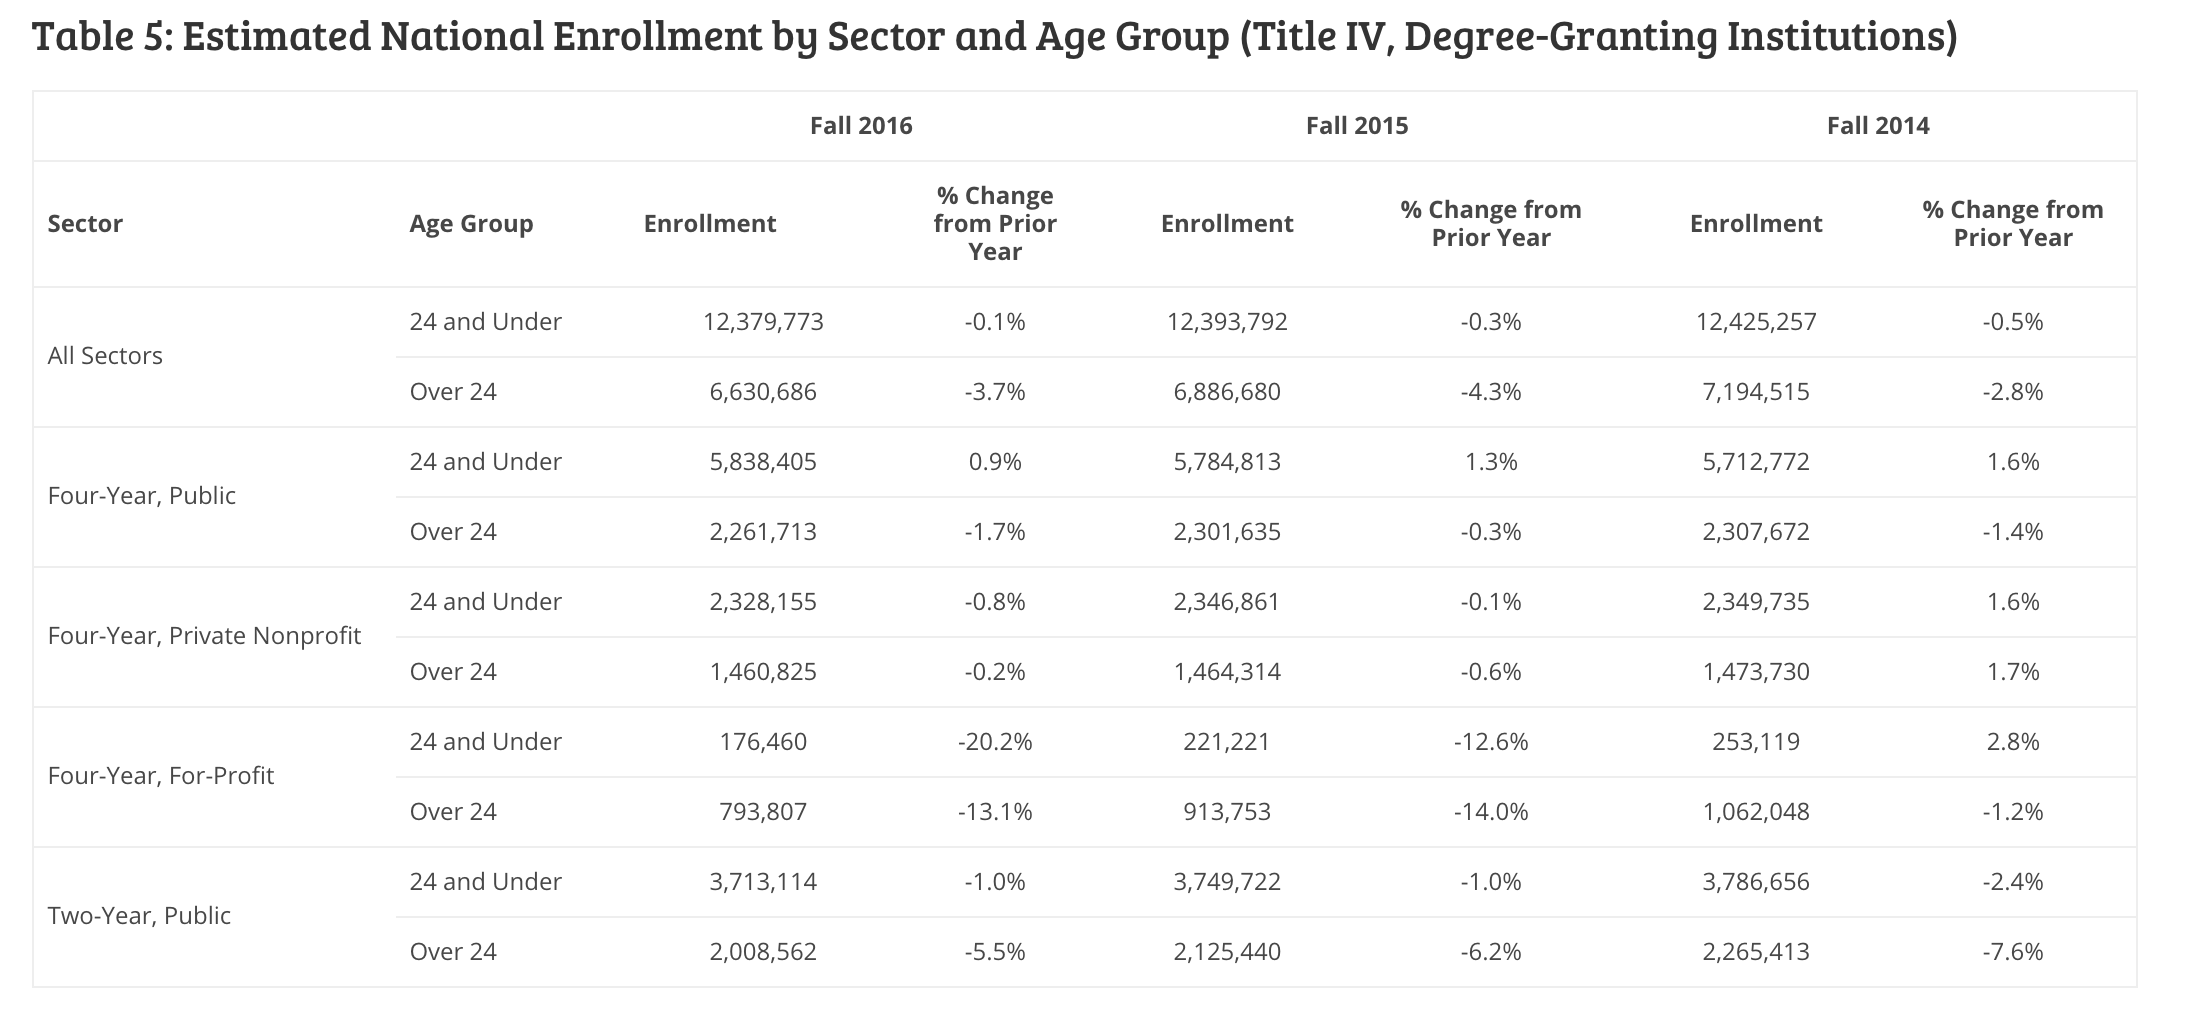
    And just like in California, adult student enrollment has been dropping much faster than 18-24 year old enrollment. 24 and under groups have dropped 1.0 – 2.4% per year while 25 and above groups have dropped 5.5 – 7.6% per year (see bottom two rows).
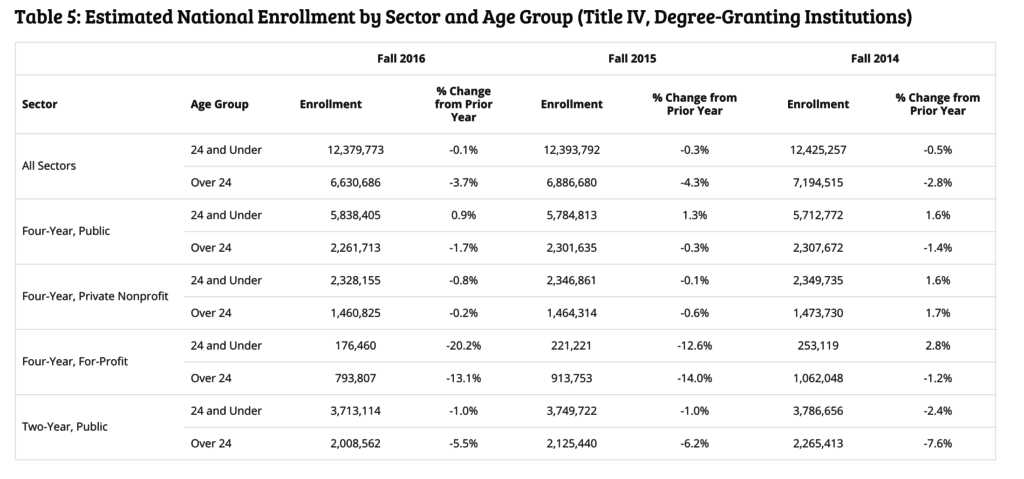
    This will be another challenge for the CCCS planning team, as there is no indication that California is screwing up while other states have the same problem figured out – the reduction in community college enrollments, particularly for adult students, appears to be a nationwide demographic trend.

    Comparison Colleges

    Assuming that the plan works out and they find new enrollment opportunities that don’t cannibalize existing college student groups, it is also worth considering how large this college might become. I pulled together the IPEDS data for several of the top-growing online undergraduate colleges ((The comparison colleges might not be exclusively online, but they have become at least predominantly online.)) to get some idea of what the best-case scenario might be in terms of enrollment growth. This data looks at fall enrollment numbers which will be lower than full-year headcount numbers.
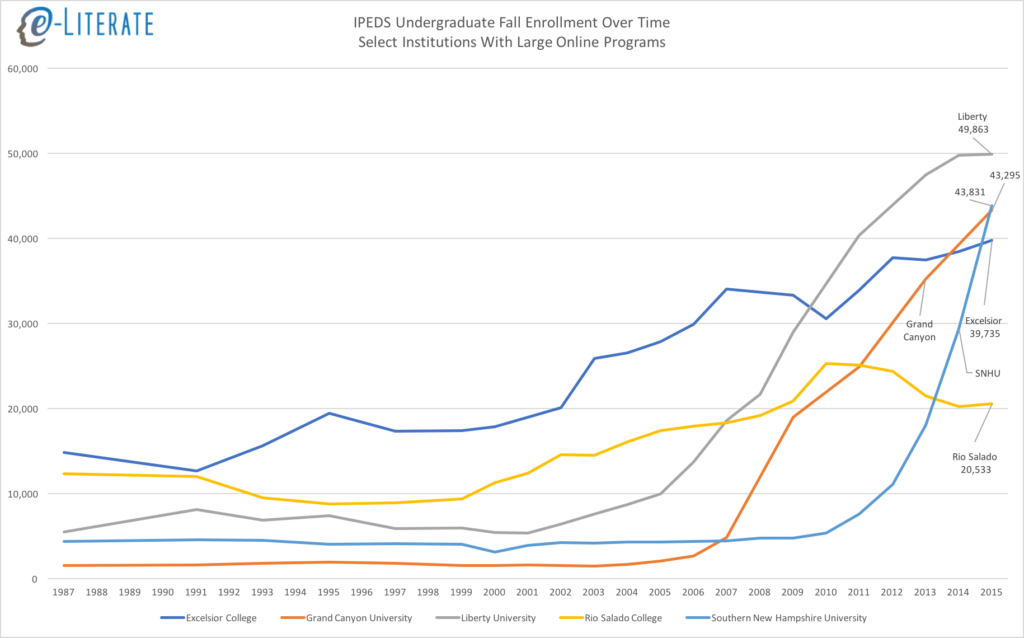
    Once we get past the “holy crap, look at Southern New Hampshire University’s (SNHU) growth”, there are a few observations to make.

    • We’ll have to see where SNHU goes, but there has traditionally been a ceiling to the size of online enrollment per institution of around 80,000 – 100,000. The primary exception has been the University of Phoenix that reached a quarter of a million online students back in 2010, but their enrollment has been dropping since then and are more of the exception that proves the rule. All others have peaked well under 100,000 students. Just this spring Liberty University experienced their first recent enrollment drop, leading to staff layoffs.
    • The maximum growth rate of these cherry-picked successful schools ranges from ~1,200 / year for Excelsior to ~7,700 / year for SNHU (note that Rio Salado at ~1,400 / year is the only public institution). Add to this the fact that all of these schools have been around for decades. No accreditation issues, no time-consuming establishment of core leadership team, etc.
    • There is a big difference in dealing with institutional issues and statewide issues, particularly in California. One in five US community college students in the US do so in California, and the statewide issues tend to come in large numbers. Statewide issues tend to come in hundreds of thousands while institutional issues tend to come in tens of thousands.

    What this points to is that for a new fully-online institution to get to some meaningful level of enrollment (let’s say 20,000) in the same ballpark as these comparison schools, I estimate it would take a full decade at the least. This is the reason, by the way, that Mitch Daniels and Purdue University made the Kaplan University deal even though Kaplan’s enrollments are dropping. Daniels did not want to wait a decade to get to meaningful enrollment numbers for an online college serving working adults – if everything works out, within a year Purdue will have a fully-online institution serving 30,000+ working adults. That is a big if, by the way.

    None of this analysis is to argue that CCCS should not try to establish a fully-online college. The goal of better serving nontraditional populations – adult students with and without jobs – is worth pursuing on its own merits.

    The numbers do argue, however, for a realistic view on the challenges they face:

    • Fighting against national demographic trends for adult students of community colleges;
    • Trying to avoid cannibalizing enrollment from existing California Community Colleges;
    • Having the patience to support the schools while it take years to grow to a size with meaningful enrollment levels; and
    • Accepting that best case this approach probably recovers less than 10% of the enrollment drop since 2009.

    I would hope that the CCCS planning efforts take the hard numbers into consideration when searching for different options to satisfy the governor’s directive.

  • MOOCs Now Focused on Paid Certificates and OPM Market

    MOOCs Now Focused on Paid Certificates and OPM Market

    Writing in EdSurge, Dhawal Shah from Class Central describes the mostly-complete transformation of the large MOOC providers – Coursera, Udacity, edX, FutureLearn – away from lifelong learners and towards paid certificates and a form of Online Program Management for Master’s degrees. No one still claims that MOOCs will disrupt the university as previously hyped. Referring to these previous claims:

    Now, more that five years later, we know this [disruption of universities] is not the case. I started Class Central at the end of Nov 2011 as a side project to keep track of free online courses, so I’ve followed the space closely right from the beginning. MOOC providers have learned a lot in the last five years, and they’re now more certain about who their real audience is—and they’re not the dabblers and lifelong learners who take courses just for curiosity’s sake.

    Paid Certificates

    The description of the current MOOC target audience is a twist on an old term. Shah paraphrases Coursera’s previous CEO Rick Levin and then clarifies:

    The real audience is not the traditional university student but what [Levin] calls the “lifelong career learner,” someone who might be well beyond their college years and takes these online courses with the goal of achieving professional and career growth. [snip]

    Traditional lifelong learners might learn due to their love of learning, but in the case of lifelong career learners, the “lifelong” part is driven by the necessity of constantly adapting to the changing job market. Learning for the sake of learning sounds appealing, but, at least anecdotally, I hear from many people find they are more likely to make significant progress or even complete a course when they are tied to professional outcomes (that’s certainly my experience).

    Typical paid programs lead to certificates and may be sponsored by the employer and may be tied to a monthly subscription.

    Shah also describes how the MOOC providers have dramatically reduced the offerings and features available for free, lamenting at the end:

    But if you are true lifelong learner—the ones that helped start all the hype in the first place—the MOOC experience has largely been reduced to basically a YouTube playlist with a cumbersome user interface.

    Unless, of course, you are willing to pay.

    OPM Progress

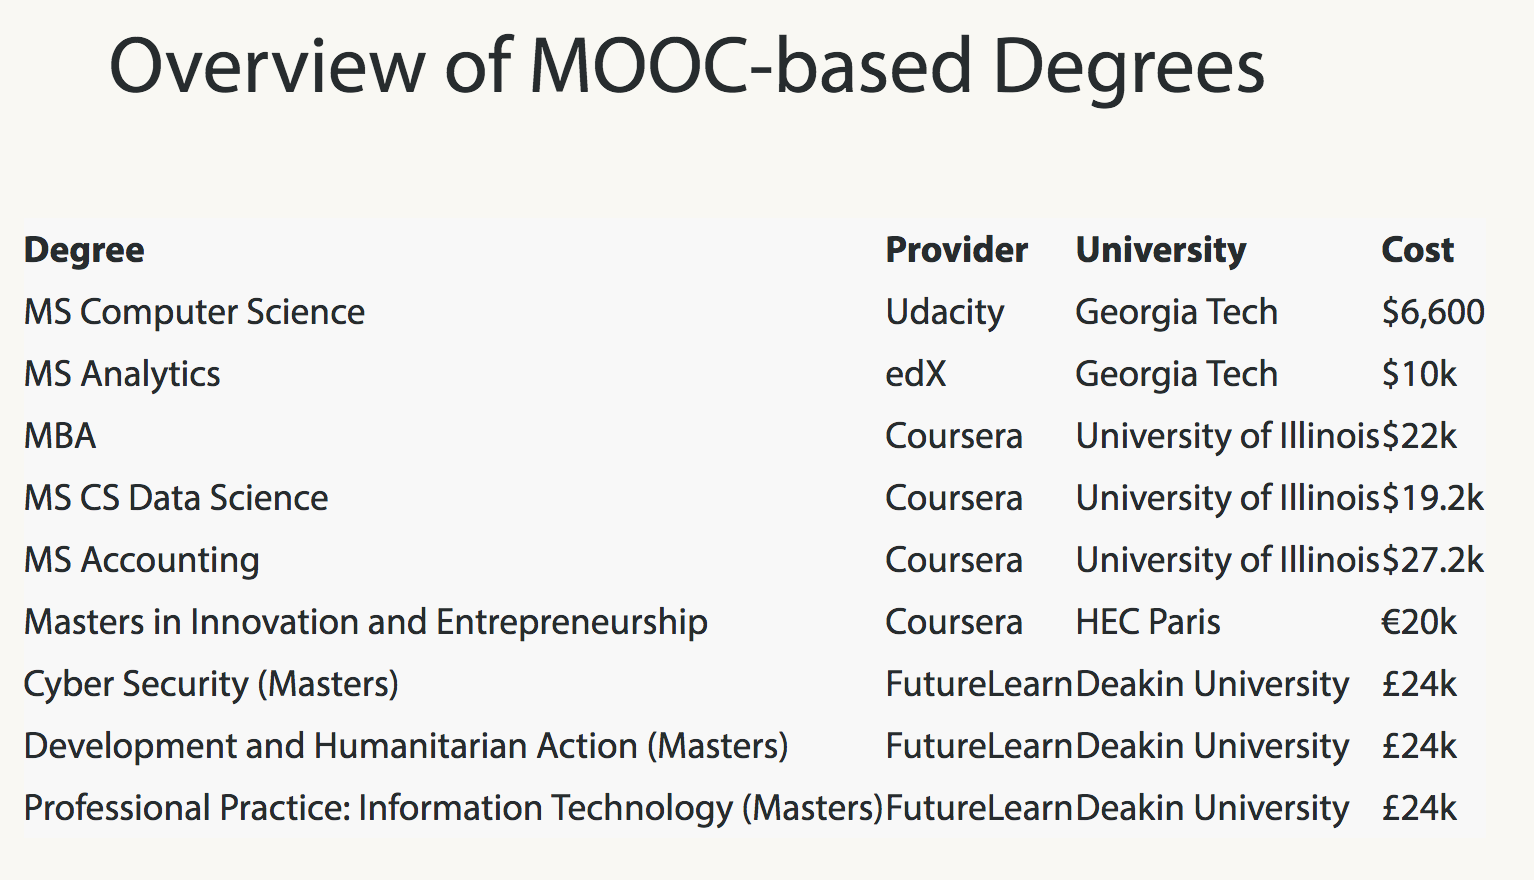
    Shah also linked to a previous post of his at Class Central describing the progress made by the MOOC providers in creating an Online Program Management (OPM) business model. Udacity started this movement with their Master’s of Computer Science degree at Georgia Tech, but now the other vendors are following suit. Coursera announced their fourth program in March (three of them at the University of Illinois), edX added one at Georgia Tech, and FutureLearn announced three programs at Deakin University in Australia. All told, there are now 10 programs identified where the MOOC providers are acting as OPM providers, albeit from four universities. From the April post:

    In a post describing the OPM market last year I noted:

    The OPM market is interesting and dynamic. Here we see strong arguments for both bundled revenue-sharing models and for unbundled fee-for-service models. I personally do not believe that the market is moving away from revenue sharing as much as there is pressure for additional models. There are a growing number of choices available to schools, but there is also a crowded marketplace that is becoming more difficult to understand and compare vendors.

    The 10 programs mentioned above now represent one of these “additional models” in the crowded marketplace.

    For those wanting to understand where the large, commercial MOOC market stands in 2017, I recommend reading both of Dhawal Shah’s posts – from April at Class Central and July at EdSurge.

  • Follow-Up From Future Trends Forum Discussion On Learning Platforms

    Follow-Up From Future Trends Forum Discussion On Learning Platforms

    Last Thursday I participated in a Future Trends Forum, hosted on the Shindig platform, with host Bryan Alexander on the topic of “What’s next with the LMS?”. I have to admit this was one of the best virtual discussions I’ve had, and more than half of the session was driven by audience questions. You can check out the Twitter discussion, Storified , or listen to an audio recording of the whole session, thanks to Roxanne Riskin. Update: See YouTube video of event posted at end.

    As Bryan described in his blog post:

    Yet maybe the conversation won’t stop there, at 3:05 pm EDT on June 29th. Because when we broke we had more than thirty (!) unanswered questions remaining from the Forum community. I’d like to share those now, so that Phil can respond, but also so that anyone can dive in, whether or not you participated yesterday.

    I don’t have enough time to address all the of the questions, but I would like to tackle a few. We’re also talking about having a part 2 and bringing in Michael in late August. In the meantime . . .

    • Competitiveness – Is the lack of competitiveness due to a lack of innovation or because IT decision makers are looking for consistency/ease of support?

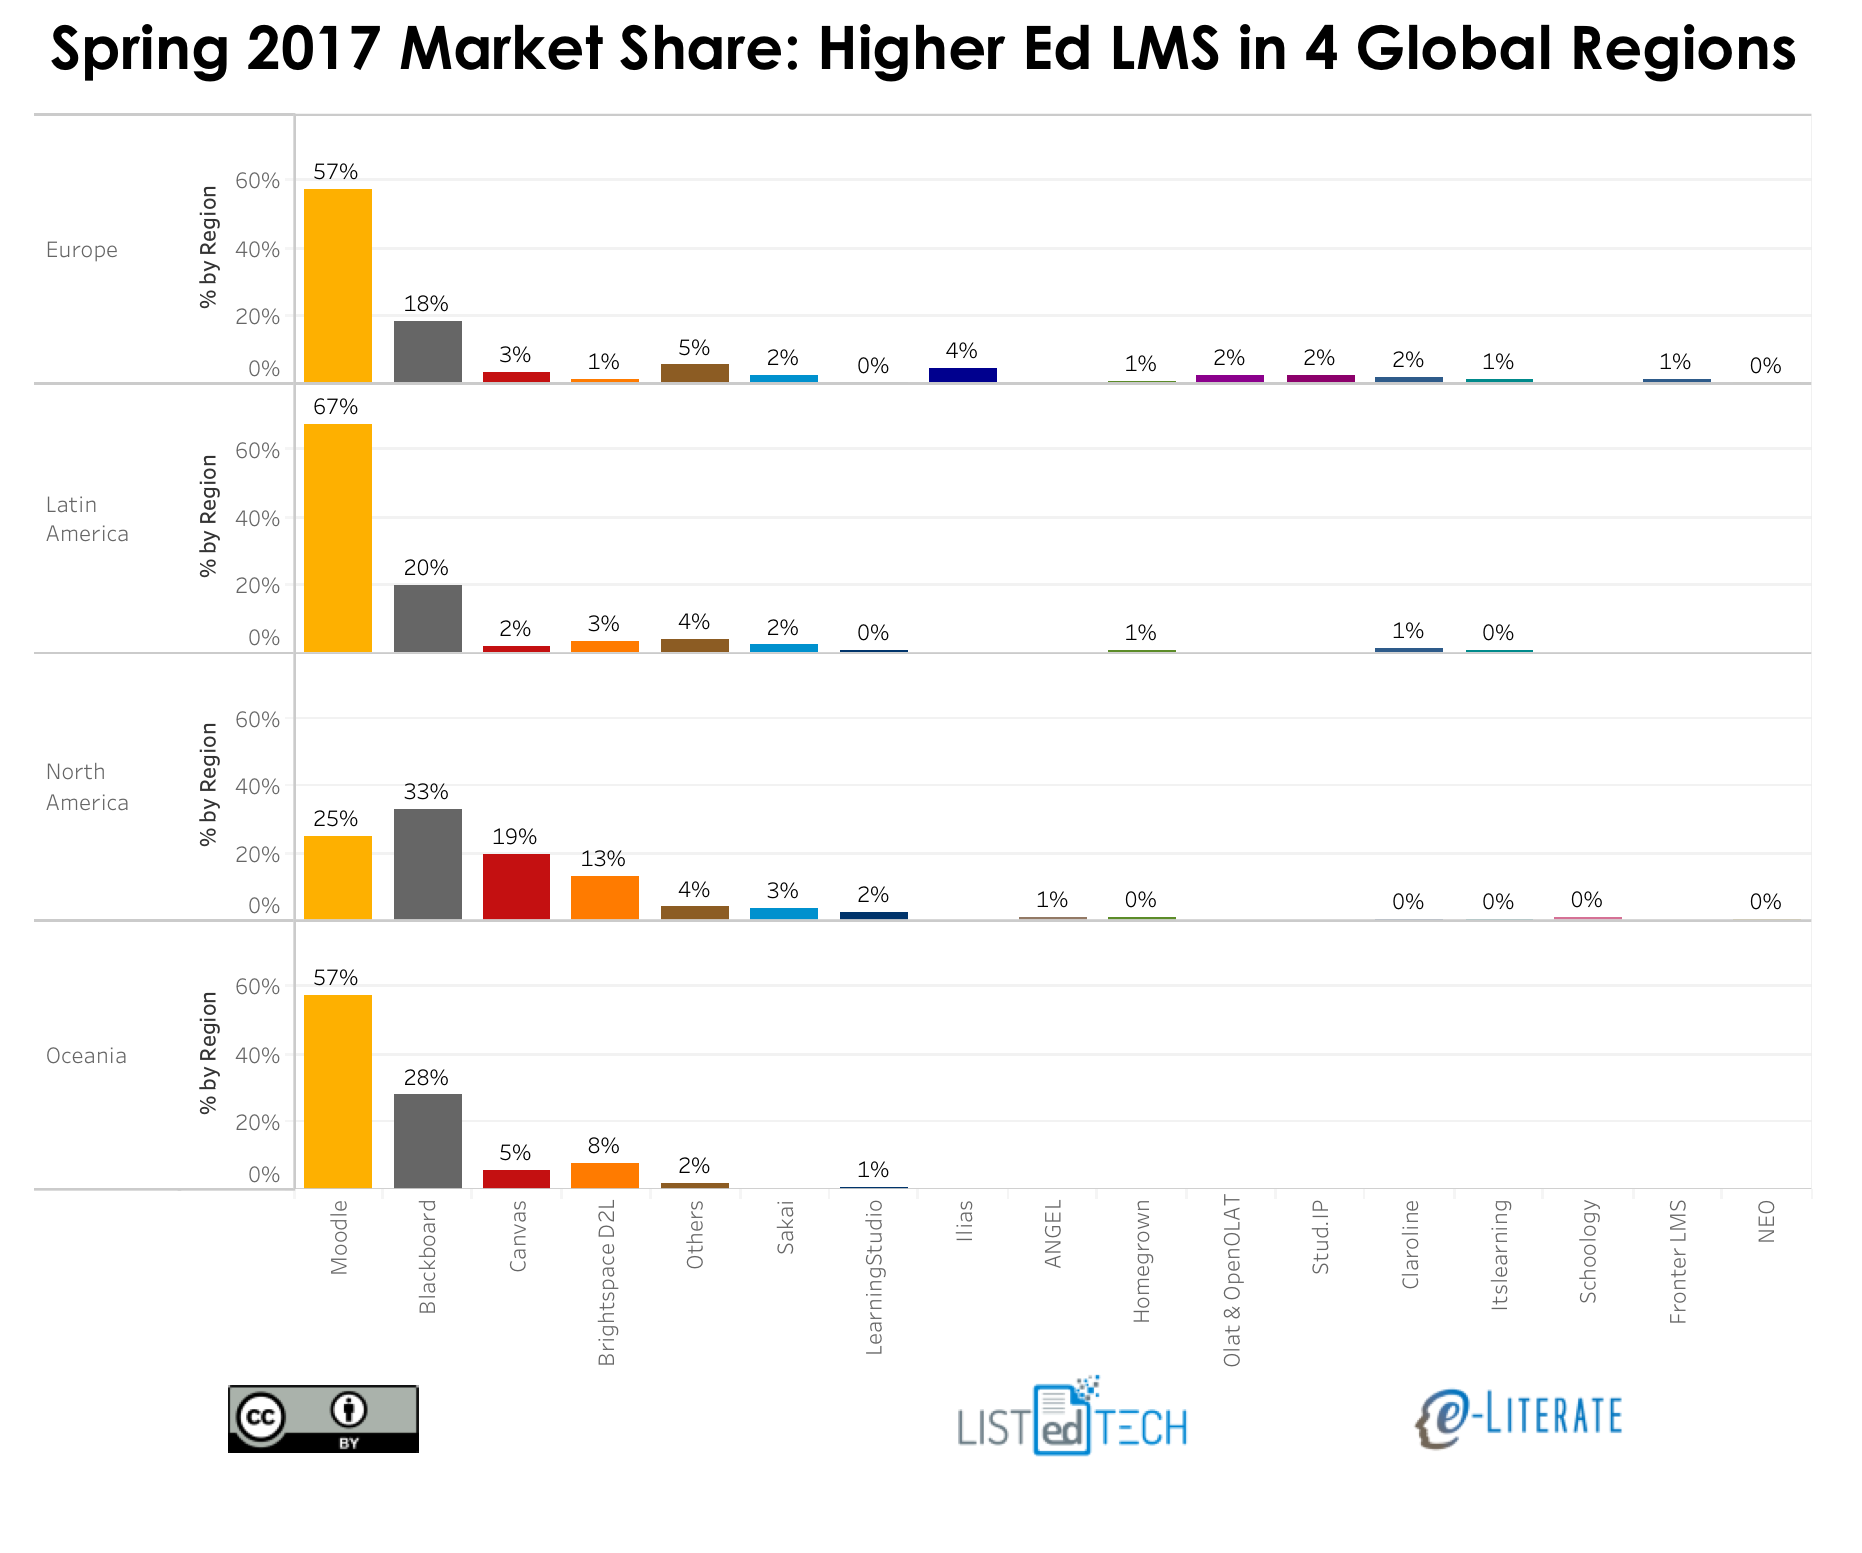
    This question refers to the point I made in this blog post that in four global regions we have two companies dominating the installed base (Moodle, Blackboard), one dominating new implementations (Canvas) with one gaining recent momentum (D2L Brightspace). That’s four solutions dominating across the globe for higher education, hence the “lack of competitiveness” in the question.

    While I think the market needs more innovation, I don’t think that’s the primary cause of this emerging four-way oligopoly. One issue more important than pure innovation is that ed tech is a difficult market in terms of scaling a business, and it is difficult to remain profitable. Canvas is growing fastest, and Instructure (parent company) plans to be cash-flow positive in 2018. As in, Instructure is not profitable yet. Just two years ago Moody’s changed their outlook on Blackboard to negative due to very high debt to EBITDA ratios and “stagnating revenues”.  We have little public information on D2L, but I have pointed out company layoffs occurring after the large investment rounds. Moodle is open source and not directly a system with profits. This comes at a time when the expectations for competitive LMS offerings is rising in terms of cloud hosting and interoperability and intuitive user experience. This is not an easy business.

    • What are your thoughts about competency-based education (CBE)? In particular, with Elliucian leaving the space, do you see a market for a CBE-targeted LMS? And, which products do you see as leaders? or potential leaders?
    • CBE – You’ve brought up CBE a few times. Do you feel there is slower than expected growth for colleges/univ for CBE. Hence, the sun setting of Ellucian’s platform. Or, perhaps, are they force fitting the current LMS to be their CBE LMS?

    See this post describing the very slow growth of CBE platforms. If you think the institutional LMS market is difficult, try the CBE platform market. We do not have the same level of market data for CBE as we do for LMS, but anecdotally I believe that Sagence Learning (formerly FlatWorld) has won the greatest number of CBEN platform selections in the past year or two.

    • Have you seen any trends in terms of schools with more than one LMS – are places consolidating or fracturing? (always surprised by number of institutions that have more than one)

    There is a general, low-level trend in higher education to have fewer cases of secondary LMS usage. Mostly consolidating while aiming to increase the number of third-party apps working alongside the primary system.

    • hosted vs. not hosted – For those LMSs that aren’t open source, do you have any thoughts on how institutions are managing systems – are they choosing to host themselves or are they choosing to use vendor hosting (or other options)?

    In all four global regions we have covered (North America, Europe, Latin America, Oceania), there is a move towards managed and cloud hosting and away from self-hosting. In North America, more than 90% of new LMS selections are going straight to managed or cloud hosting. Europe trends the same direction but is roughly 50 / 50 for new implementations. And I should point out that these trends exist for open source solutions – maybe not to the same level, but in the same direction.

    • K-12 – following up on Schoology and google classroom, what force is K-12 going to be in the future of higher ed LMS? can the teaching energy and innovation of K-12 energize higher ed teaching…?

    I have written several posts on Google Classroom, although I need to do an update. The general answer is that neither Google Classroom or Facebook Classroom show significant signs of affecting the higher ed market. There is some interest in both platforms, but mostly from a small number of individual faculty. And neither platform is designed to solve the gradebook or system integration needs of higher ed. Yet.

    We have several posts on Schoology, which has a bigger potential impact on higher ed for a K-12 based system.

    • Finally, we partially discussed a set of question from Fred Beshears, summarized in this new post. The general topic is around CBE platforms and whether LMS systems are moving to support “massive student information profiles” (across courses for large numbers of students) or whether this is being relegated to student record systems. We partially address these questions in the Future Trends Forum, but not entirely. Hopefully we’ll see others jumping into the online discussion. Update: See discussion thread at Bryan’s post for discussion on this topic.
    • (Update: Finally, finally) I answered two questions in the session about the potential of the LMS as an integration hub, bringing in third-party apps rather than being monolithic systems. The answers were admittedly aspirational. George Station made a good point on Twitter that there is another side to the LMS impact on pedagogy:

    I do agree that this has happened, as covered further in replies to that tweet.

  • Academic LMS Market Share: A view across four global regions

    Academic LMS Market Share: A view across four global regions

    In much of our coverage of the LMS market as well as media stories, there is a natural tendency to focus on change. Institution x abandons LMS y and adopts LMS z. In our recent post on Moodle, I described the trajectory of Moodle, noting that “the data seem to indicate a collapse of Moodle selections in the US and Canada, and potentially a significant slow-down in other regions”.

    But we need to be careful to not lose perspective and miss the installed base of LMS customers. While there has market share information for US higher ed available for years, we can now share the broadest description of LMS market share in higher education. The view below, originally shared with subscribers to our LMS market analysis service, shows market share as the percentage of primary systems at degree-granting institutions for each of four global regions: North America (US and Canada), Europe, Latin America, and Oceania (Australia, New Zealand and surrounding island countries).

    (more…)