The current pandemic is forcing us to rethink much that we used to take for granted. This is true in EdTech as much as anywhere else. For example, while privacy advocates have been shouting into the void about how we should all pay more attention to seemingly boring and definitely complicated legal and technical privacy protections in the EdTech products we use, the Zoom debacle has finally brought more attention to the issue. To reduce the chances of many equally bad privacy problems going unnoticed, we must improve both the tech privacy literacy of people purchasing or selecting the products and the craft of transparency on the part of the product providers. University folk need to become better at reading privacy assurances critically while the service providers need to become better at writing those assurances clearly.
The same goes for the teaching value and effectiveness of products. While this term has been a scramble just getting students online and doing the best that we can for them, next term there will be less excuse for slapdash use of random EdTech products. We must get better at evaluating the strength of vendor claims regarding the improvements in student impact that educators can achieve using their products and, likewise, the vendors much get better at communicating their evidence of impact. This has always been true, but now it is also more obviously urgent. We need to get better at talking about what works, under which circumstances, and how we know what we think we know.
EEP sponsor Macmillan Learning, my most recent guest on the e-Literate Standard of Proof webinar series, talked about how they both test what they know about the effectiveness of their products and communicate what they think they know to customers in the crucial early stages of product development, when there aren’t enough data to make strong claims based on mountains of evidence. This work must be a collaboration with educators in at least two senses. To begin with, EdTech products generally rarely have a significant impact on their own. They usually have the most effective when they are paired with appropriate and effective teaching practices. So early EdTech product development work must involve working with faculty to understand both what they do in the classroom and what they might be willing to do try doing differently if they had a product with affordances that supported a teaching practice that is novel to them. Second, as product developers making increasingly confident claims about their product, those claims—and the process by which they were derived—must be reviewed by academic experts who can provide peer review to both the experimental design before it is used with students and the interpretation of results as the data come in.
As a (paid) member of Macmillan’s Impact Research Advisory Council (IRAC), I have had the pleasure of both observing and participating in their process. Their model of early research and transparency in reporting is a contribution to the field.
Here’s the interview:
Macmillan Learning on e-Literate’s Standard of Proof webinar
I have some announcements and updates to share regarding the Standard of Proof webinars. All good stuff, which I’m sure we could all use more of these days. As a general reminder, Standard of Proof webinars are always about contributions that vendors have made to our general knowledge or capabilities for supporting students—i.e., contributions that don’t just help their own customers—and they always include academics who were meaningful partners in the work. Companies featured in the Standard of Proof webinars are all sponsors of the Empirical Educator Project (EEP), but sponsorship does not guarantee a webinar. Only a qualifying contribution to the educational commons, as judged by me, earns them a webinar. This is not just promotional fluff. So I’m pleased to share the latest with you, which you’ll see represents an uptick in our tempo.
First, the video archive of the webinar on the LXPathways learning architect and instructional technologist competency programs from iDesign is now live on YouTube. Or you can just watch it here, if you have the hour:
iDesign LX Pathways Standard of Proof webinar
Second, a reminder that we have a webinar tomorrow with Macmillan on their method for studying the effectiveness of their products early in the product development cycle. I serve as a (paid) member of the Macmillan Impact Research Advisory Council (IRAC), so I have had both a ring-side seat and some input on this process. The transparency they are attempting to provide regarding what they know about product impact, how they know it, and how confident they are in the results at any given moment is commendable. I’m looking forward to that conversation tomorrow, i.e., Wednesday, March 10th at 2 PM ET. Register for the Macmillan efficacy methodology webinar here.
Third, you may have seen an announcement go out earlier today about our webinar for next Wednesday, March 18th at 2 PM ET for our Driving Toward a Degree webinar with Tyton Partners. We still have a lot to learn about increasing graduation rates, particularly among first-generation, post-traditional, and underrepresented students. Tyton has made an important contribution with their finding of the value of a coordinated response that far too few colleges and universities even attempt to achieve for this sort of effort. Their methodological approach to studying the impact of different approaches is also really interesting. Register for the Driving Toward a Degree webinar here.
And finally, I have a hold-the-date pre-announcement for a follow-up webinar on the research AdmitHub has been doing. (You can see the video of our webinar with them on summer melt here.) This research has broader implications for helping students get to graduation. I’ll hold the details until we have the description nailed down with the participants—this is new research, so I always want to get the characterization right—but for now, save the date for a webinar on Thursday, April 9th at 2 PM.
I am just thrilled to post the archive of our inaugural Standard of Proof webinar:
Summer Melt Standard of Proof webinar
https://youtu.be/7NoYUa_VHfs
It is a near-perfect encapsulation of everything that the Empirical Educator Project aspires to promote and foster: front-line educators, academic researchers, and commercial vendors working together to measurably increase student success and to do so in a way that is both persuasive in terms of the rigor of evidence and repeatable by other institutions.
As a reminder, Standard of Proof highlights academic collaborations by the Empirical Educator Project’s commercial sponsors with academic researchers and academic practitioners. All projects must either contribute new knowledge to the commons or promote the diffusion of established evidence-backed practices.
In this case, we have a story of a small EdTech start-up—AdmitHub—that has a total of nine randomized controlled trials either completed or in process with academic partner institutions.
Nine.
How many of your EdTech vendors have nine randomized controlled trials either done or in the works? How many have one? How many have you even asked this question? (If you want better answers on the first two questions, then try to improve your answer to the last one.)
They were able to do this, in part, because institutions like Georgia State University had real leaders, like GSU’s Tim Renick, who refused to accept the proposition that disadvantaged students were already beyond help by the time they got to college. Instead, the GSU folks (and their colleagues at other academic institutions conducting research with AdmitHub) set out to study their own practices and identify areas that they were failing students in ways that could be fixed. Using data, with the help of their vendor and an academic researcher—in this case, University of Pittsburgh Professor and summer melt expert Lindsay Page—GSU demonstrated that we can make education better and more equitable. It is the perfect counter-example to the sad situation I described in my post on what I didn’t see at EDUCAUSE.
This is the future that we all should be reaching for, folks. And it is reachable, as all three of my guests made clear. The video is well worth an hour of your time. Standard of Proof webinar production values will improve as we learn our craft, but the conversation quality just doesn’t get much better than this.
We’re actively working on the spring webinar line-up and will have some juicy conversations scheduled by the time you return from your holiday break.
Today I am sharing the first video out of the Empirical Educator Project (EEP) 2019 summit, and with it, a central concerns of the project. Much of the basic machinery our learning processes work so naturally and automatically so much of the time that they are invisible to us. So pervasively invisible, in fact, that most of us are barely aware that it even exists. And that’s a problem. If you believe that the job of education is to work within what psychologist Lev Vygotski called the “zone of proximal development”—the kind of learning challenge that would be too hard for a student to learn on her own but not so hard that she can’t learn it at all—then we have to have a very finely tuned understanding of that learning machinery, to the point where we can accurately find each student’s zone of proximal development with a high level of consistency.
We fail to do this all the time. Some students are bored while others struggle. The more heterogeneous the student population is, the bigger a problem this is. As higher education as a sector becomes more committed to serving post-traditional students, first-generation students, and students with 40-year educational relationships to the school rather than 4-year relationships, then this need to be able to see and understand these invisible learning processes becomes more acute. For this reason among others, fostering academic literacy around the mental machinery of learning—making the invisible visible—is one of the central goals of EEP. I therefore wanted to start the 2019 EEP summit by highlighting this challenge. So I invited three Carnegie Mellon University (CMU) professors with complementary areas of expertise to participate in a panel that could highlight several dimensions of the problem.
This wasn’t the first time I had interviewed these three particular academics. I had been fortunate enough to be invited to a CMU press fellowship three years earlier. I brought my video camera along and happened to be able to get some air time with these very three people, two of whom I had never met before. The interviews turned out to be formative for me, particularly with regard to my thinking about EEP. I’m going to write a little about the complimentary insights that these three academics gave to me and then share both the interview video from the summit and the original interview videos from two years ago.
Expert blind spots
As we get old and forgetful, we like to joke that our minds have to make room for the new information by clearing out old information. It turns out that there’s truth behind this joke in multiple ways. First, we have different kinds of memory. If I asked you to list the steps required to tie your shoe, those steps would probably not come tripping off your tongue. Does that mean that you don’t know how to tie your shoe? No, it doesn’t. It means that you’ve moved that knowledge to a more efficient memory space in your brain. One that’s quick and efficient enough that you can easily bend down and tie your shoes while performing other, more demanding cognitive tasks. But that knowledge is not accessible to your conscious mind. It is “tacit” knowledge. Your brain is very efficient at shunting information that it needs to access but does not need to consciously examine into a different compartment than the one it was in when you were learning a skill.
There was a time when you could list the steps in tying your shoe, because that was how you first learned those steps. Your brain put that information into a box once it no longer needed conscious access to it. Chances are good that you don’t remember that time well and that you don’t remember the experience of those steps fading from your conscious memory. I tried to recreate this experience recently for myself. I am learning to swim. In the first weeks, I was thinking about about very basic aspects of moving my arms and, separately, moving my legs. That period was about nine months ago. I decided to try a little experiment with memory encoding in the process. Every two weeks, I would try to remember the steps that I learned in my first lesson. I didn’t try to memorize those steps. That would be triggering a different memory process and would invalidate the experiment. I just tried to reconstruct the steps in my mind. Meanwhile, I spent most of my time at the pool learning to be a better swimmer.
As the weeks went on, I found myself thinking less about what my arms and legs were doing separately and more about what my whole body was doing. I also found it harder and harder to remember what the original steps were that I learned in my first lesson. Nine months in, I barely remember anything about how I first thought about what I was doing. If I had to teach somebody to swim from scratch, I couldn’t just reproduce the lesson that was taught to me. I’d have to make something up. Nor could I reproduce the learning steps I took—many of which I made on my own, without my instructor—to get from my beginner’s understanding to the level of expertise I have achieved as of today. I might be able to draw on some of my knowledge and experience, but I would have to invent more of my teaching moves than most teachers like to admit, through trial and error, by working with students.
So our brains do, in fact, make room for new information by boxing up old information and putting into storage. In addition to the memory changes, we also process information differently as our domain knowledge gets more sophisticated. When you’re learning math, or cooking, or yoga, or any other discipline with integrated skills that build on each other, at first, you’re learning each skill separately. Over time, your mind integrates steps and makes general rules. As novice cooks become expert cooks, their way of thinking about cooking looks less like meticulously following one out of hundreds of completely separate recipes and more like following some generalized principles that they’ve drawn from their experience of making so many recipes. They stop thinking algorithmically and start thinking heuristically.
We don’t generally notice these changes in our cognition as we move from novices to experts in a topic. They’re not directly observable and not usually consciously experienced. They just happen. This is a problem for teaching because professors, as experts, have undergone all of these changes in their learning processes. They no longer think they way their students do. They don’t think about cooking as following individual recipes. Further, because their evolution as thinkers was largely silent, and because most professors have no professional development in these processes, it’s not always obvious to them the extent to which their brains process information in fundamentally different ways than those of their students. Ironically, it is their very expertise that causes them to struggle sometimes to understand how their students think about their subjects or how to work with them in that zone of proximal development. CMU Professor Ken Koedinger, Director of LearnLab at the Pittsburg Science of Learning Center, is an expert in this conundrum.
Expert teaching blind spots
There’s a related phenomenon that I’ll call an expert teaching blind spot, even though I don’t think that’s an official term of art. Just as it is possible to not consciously know what you know in any domain of knowledge, it’s possible to have tacit knowledge specifically in teaching. In addition to the reasons above, I’ll add another one: Interpersonal skills, including teaching skills, are somewhere in the middle of learning spectrum between things that we are hardwired to learn without anyone specifically teaching us (like spoken language as young children), and something that is an intellectual creation which must be consciously learned (like political science). Many educators have what we colloquially refer to as teaching “instincts,” and that word is not far from the truth. We have tacit interpersonal knowledge, sometimes including tacit knowledge about learning processes of our students. We know some things about how to teach in a very real sense, but that knowledge is not fully consciously accessible to us.
As a result, it can be very difficult to talk to even highly skilled teachers about what they do, because in many cases they’ve never even tried to put what they do into language. They just do what seems right and obvious to them. And if they do verbalize what they’re doing, they usually aren’t using terms of art because they usually haven’t been taught any. Their insights seem personal because nobody has talked to them that beyond the personal and phenomenological there could be a sharable, learnable, teachable body of knowledge that their instincts are tapping into. CMU’s Marsha Lovett, Director of Eberly Center for Teaching Excellence & Educational Innovation is an expert in this problem domain.
If we don’t have a coherent answer, then we make one up
If you put all of this together, it adds up to a very significant challenge to serious educators. They don’t have easy ways of knowing how they think differently than their students or easy access to their own cognitive journeys that got them from novice learners to expert learners. And yet, most of us have vivid memories of our formative experiences as students. On top of that, teachers teach, and students learn. It happens all the time. Humans are such incredible learning machines, and the machinery is so well hidden from us, that many people tend to assume that there really isn’t much to it (when nothing could be further from the truth). Most professors are good at academic learning. That’s how they ended up as professors.
And they usually had at least one experience that really inspired them to learn about their chosen field. That association is often all it takes for educators to attribute causality. “Well, I had an amazing experience in Professor Smith’s class, and Professor Smith did X, so X must be a great way to teach.” Given that most professors diligently worked through five to seven years of graduate school without being exposed to the tiniest hint of any of the above and then were expected to somehow magically know how to teach well, what tends to happen is that professors make up their own stories about what effective teaching is based on their own personal experiences—which is the only data they have, really—and they go on that. And they don’t change their minds about it very much or very easily. CMU anthropologist and Simon Research Faculty Lauren Herckis has conducted some fascinating research in this area.
We have a literacy problem
If you put all of this together, it’s clear that we’re not going to make substantial progress on improving education until educators are taught to see that which is currently invisible. We have to develop a common cultural understanding that learning involves a complex set of cognitive processes, that being an expert in a knowledge domain is not sufficient to be a good teacher of novices, that good teaching instincts are often based on tacit knowledge which we can make explicit and therefore more sharable and useful. Only by doing this together, as a sector, can we make substantial progress on improving student success. One of the main goals of Empirical Educator Project is to begin fostering the cultural infrastructure that we need in order to do that.
Here are the three original video interviews I conducted of Marsha, Ken, and Lauren two years ago:
e-Literate TV CMU Interviews
I got lucky with those interviews. The coherence in the interviews is a product of the coherent body of work at CMU’s Simon Initiative as represented by the three people who happened to be available to interview rather than through some master plan of mine.
At the summit, I chose to frame up both the discussion and the event more consciously. In addition to their work, I asked the three to reflect on their personal journeys as educators to embrace views about teaching and learning that may have seemed surprising or even counter-intuitive to them:
The journeys that these experts describe are emblematic of the bigger picture that EEP is all about. And not just in classroom work specifically, but in every aspect of serving students.
I have said before that academia needs to move from a philosophical commitment to student success toward operational excellence at supporting student success. The implied gap is knowhow. It will show up differently in the classroom than it will in, say, advising, but the pattern is going to be the same, and I think academics will be most comfortable thinking about it as starting with a literacy problem. There is some discipline, either new or existing, that they must learn to some degree of competence in order to serve their students well. They might not have to be expert in it—they don’t have to have PhDs in cognitive psychology, for example—but they do need to be literate in it.
A few weeks back, I had the pleasure of attending the IMS Learning Impact Leadership Institute (LILI). For those of you who aren’t familiar with it, IMS is the major learning application technical interoperability organization for higher education and K12 (and is making some forays into the corporate training and development world as well). They’re behind specifications like LIS, which lets your registrar software automagically populate your LMS course shell with students, and LTI, which lets you plug in many different learning applications. (I’ll have a lot more to say about LTI later in this post.)
While you may not pay much attention to them if you aren’t a technical person, they have been and will continue to be vital to creating the kind of infrastructure necessary to support more and better teaching and learning affordances in our educational technology. As I’ll describe in this post, I think the nature of that role is likely to evolve somewhat as the interoperability needs of the sector are beginning to evolve.
The IMS is very healthy
I’m happy to report that the IMS appears to be thriving by any obvious measure. The conference was well attended. It attracted a remarkably diverse group of people for an event hosted by an organization that could easily be perceived as techie-only. Furthermore, the attendees seemed very engaged and the discussions were lively.
On more objective measures, the organization’s annual report bears out this impression of strong engagement. They have strong international representation across a range of organization types.
From the IMS Global 2018 Annual Report
Whether your measure is membership, product certifications, or financial health, the IMS is setting records.
From the IMS Global 2018 Annual Report
This state of affairs is even more remarkable given that, 13 years ago, there was some question as to whether the IMS was financially sustainable.
From the IMS Global 2018 Annual Report
If you look carefully at this graph, you’ll see three distinct periods of improvement: 2005-2008, 2009-2013, and 2013-2018. Based on what I know about the state of the organization at the time, first period can most plausibly be attributed to immediate changes implemented by Rob Abel, who took over the reins of the organization in February of 2006 and likely saved it from extinction. Likewise, the magnitude of growth in the second period is consistent with that of a healthy membership organization that has been put back on track.
But that third period is different. That’s not normal growth. That’s hockey stick growth.
I am not a San Franciscan. By and large, I do not believe in heroic entrepreneur geniuses who change the world through sheer force of will. Whenever I see that kind of an upward trend, I look for a systemic change that enabled a leader or organization—through insight, luck, or both—to catch an updraft.
There is no doubt in my mind that the IMS has capitalized on some major updrafts over the last decade. That is an observation, not a criticism. That said, the winds are changing, in part because the IMS has helped move the sector through an important period of evolution and is now helping to usher in the next one. That will raise some new challenges that the IMS is certainly healthy enough to take on but will likely require them to develop a few new tricks.
The world of 2005
In the first year of the chart above, when the IMS was in danger of dying, there was very little in the way ed tech to interoperate. There were LMSs and registrar systems (a.k.a. SISs). Those were the two main systems that had to talk to each other. And they did, after a fashion. There was an IMS standard at the time, but it wasn’t a very good one. The result was that, even with the standard, there was a person in each college or university IT department whose job it was to manage the integration process, keep it running, fix it when it broke, and so on. This was not an occasional tweak, but a continual effort that ran from the first day of class registration through the last day of add/drop. If you picture an old-timey railroad engineer shoveling coal into the engine to keep it running and checking the pressure gauge every ten minutes to make sure it didn’t blow up, you wouldn’t be too far off. As for reporting final grades from the LMS’s electronic grade book automatically to the SIS’s electronic final grade record, well, forget it.
If you ignore some of the older content-oriented specifications, like QTI for test questions and Common Cartridge for importing static course content, then that was pretty much it in terms of application-to-application interoperability. Once you were inside the LMS, it was basically a bare-bones box with not much you could add. Today, the IMS lists 276 officially certified products that one can plug into any LMS (or other LTI-compliant consumer), from Academic ASAP to Xinics Commons. I am certain that is a substantial undercount of the number of LTI-compatible applications, since not all compatible product makers get officially certified. In 2005, there were zero, because LTI didn’t exist. There were LMS-specific extensions. Blackboard, for example, had Building Blocks. But with a few exceptions, most weren’t very elaborate or interesting.
My personal experience at the time was working at SUNY Systems Administration and running a search committee for an LMS that could be centrally hosted—preferably on a single instance—and potentially support all 64 campuses. For those who aren’t familiar with it, SUNY is a highly diverse system, with everything from rural (and urban) community colleges to R1s to everything in between, with some specialty schools thrown into the mix like the Fashion Institute of Technology, a medical school or two, an ophthalmology school, and so on. Both the pedagogical needs and the on-campus support capabilities across the system were (and presumably still are) incredibly diverse. There simply was not any existing LMS at the time, with or without proprietary extensions, that could meet such a diverse set of needs across the system. We saw no signs that this state of affairs was changing at pace that was visible to the naked eye, and relatively few signs that it was even widely recognized as a problem.
To be honest, I came to the realization of the need fairly slowly myself, one conversation at a time. A couple of art history professors dragged me excitedly to Columbia University to see an open source image annotation tool, only to be disappointed when they discovered that the tool was developed to teach clinical histology, which uses image annotation to teach in an entirely different way than is typically employed in art history classes. An astronomy professor at a community college on the far tip of Long Island, where there was relatively little light pollution, wanted to give every astronomy student in SUNY remote access to his telescope if only we could figure out how to get it to talk to the LMS. Anyone who has either taught a been an instructional designer for a few wildly different subjects has a leg up on this insight (and I had done both), but even so, there are levels of understanding. The art history/histology thing definitely took me by surprise.
A colleague and I, in an effort to raise awareness about the problem, wrote an article about the need for “tinkerable” learning environments in eLearn Magazine. But there were very few models at the time, even in the consumer world. The first iPhone wasn’t released until 2007. The first practically usable iPhone wasn’t released until 2008. (And we now know that even Steve Jobs was secretly skeptical that apps on a phone were a good idea.) It is a sign of just how impoverished our world of examples was in January of 2006 that the best we could think of to show what a world of learning apps could be like was Google Maps:
There are several different ways that software can be designed for extensibility. One of the most common is for developers to provide a set of application programming interfaces, or APIs, which other developers can use to hook into their own software. For example, Blackboard provides a set of APIs for building extensions that they call “Building Blocks.” The company lists about 70 such blocks that have been developed for Blackboard 6 over the several years that the product version has been in existence. That sounds like a lot, doesn’t it? On the other hand, in the first five months after Google made the APIs available for Google Maps, at least ten times that many extensions have been created for the new tool. Google doesn’t formally track the number of extensions that people create using their APIs, but Mike Pegg, author of the Google Maps Mania weblog, estimates that 800-900 English-language extensions, or “mash-ups,” with a “usable, polished Google Maps implementation” have been developed during that time—with a growth rate continuing at about 1,000 new applications being developed every six months. According to Pegg, “There are about five sites out there that facilitate users to create a map by taking out an account. These sites include wayfaring.com, communitywalk.com, mapbuilder.net—each of these sites probably has hundreds of maps for which just one key has been registered at Google.” (Google requires people who are extending their application to register for free software “keys.” Perhaps for this reason, Chris DiBona, Google’s own Open Source Program Manager, has heard estimates that are much higher. “I’ve seen speculation that there are hundreds or thousands,” says DiBona, noting that estimates can vary widely depending on how you count.
Nevertheless, even the most conservative estimate of Google Maps mash-ups is higher than the total number of extensions that exist for any mainstream LMS by an order of magnitude.
There seemed little hope for this kind of growth any time in the foreseeable future. By early 2007, having failed to convince SUNY to use its institutional weight to push interoperability forward, I had a new job working at Oracle and was representing them on a specification development committee at the IMS. It was hard, which I didn’t mind, but it was also depressing. There was little incentive for the small number of LMS and SIS vendors who dominated specification development at that time to do anything ambitious. To the contrary, the market was so anemic that the dominant vendors had every reason to maintain their dominance by resisting interoperability. Every step forward represented an internal battle within those companies between the obvious benefit of a competitive moat and the less obvious enlightened self-interest of doing something good for customers. This is simply not the kind of environment in which interoperability standards grow and thrive.
And yet, despite the fact that it certainly didn’t feel like it, change was in the air.
Glaciers are slow, but they reshape the planet
For starters, there was the LMS, which was both a change agent in of itself and an indicator of deeper changes in the institutions that were adopting them. EDUCAUSE data shows that the US LMS market became saturated some time roughly around 2003. At that time, Blackboard and WebCT had the major leads as #1 and #2, respectively. The dynamic for the next 10 years was a seesaw, with new competitors rising and Blackboard buying and killing them off as fast as it could. Take a look at the period between 2003 and 2013 in Phil’s squid graph: ((By the way, if you haven’t subscribed to Phil’s new blog yet, then you really, really should. Like, right now. I’ll wait.))
It was absolutely vicious.
None of this would materially affect the standards making process inside the IMS until, first, Blackboard’s practice of continually buying up market share eventually failed (thus allowing an actual market with actual market pressures to form) and, second, until the management team that came up with this decidedly anti-competitive strategy…er…chose to spend more time with their respective families. (I’ll have more to say about Heckle and Jeckle and their lasting impact on market perceptions in a future post.)
But the important dynamic during this period is that customers kept trying to leave Blackboard (even if they found themselves being reacquired shortly thereafter) and other companies kept trying to provide better alternatives. So even though we didn’t have a functioning, competitive market that could incentivize interoperability, and even though it certainly didn’t feel like we had one, some of the preconditions for one were being established.
Meanwhile online education growth was being driven by no fewer than three different vectors. First, for-profit providers were hitting their stride. By 2005, the University of Phoenix alone was at over 400,000 enrollments. Second, public access-oriented institutions, many of which had been seeded a decade earlier with grants from the Sloane Foundation, were starting to show impressive growth as well. A couple were getting particular attention. UMUC, for example, may not have had over 400,000 online enrollments in 2005, but they had well over 40,000, which is enough to get the attention of anyone in charge of an access-oriented public university’s budget. More quietly, many smaller schools were having online success that were proportional to their sizes and missions. For example, when I arrived at SUNY in 2005, they had a handful of community colleges that had self-sustaining online degree programs that supported both the missions and the budget of the campuses. Many more were offering individual courses and partial degrees in order to increase access for students. (Most of New York is rural, after all.)
The third driver of online education, which is more tightly intertwined with the first two than most people realize, is that Online Program Management companies (OPMs) were taking off. The early pioneers, like Deltak (now Wiley Education Services), Embanet, Compass Education (now both subsumed into Pearson), and Orbis (recently acquired by Grand Canyon University) had proved out the model. The second wave was coming. Academic Partnerships and 2Tor (now 2U) were both founded in 2008. Altius Education came in 2009. In 2010, Learning House (now also owned by Wiley) was founded.
Counting online enrollments is a notoriously slippery business, but this chart from the Babson survey is highly suggestive and accurate enough for our purpose:
If you’re a campus leader and thirty percent of your students are taking at least one online class, that becomes hard for you to ignore. Uptime becomes far more important. Quality of user experience becomes far more important. Educational affordances become far more important. Obviously, thirty percent is an average, and one that is highly unevenly distributed across segments. But it’s significant enough to be market-changing.
And the market did change. In a number of ways, the biggest one being that it became an actual, functioning market (or at least as close to one as we’ve gotten in this space).
When glaciers recede
Let’s revisit that second growth period in the IMS graph—2008 to 2013—and talk about what was happening in the world during that period. For starters, online continued its rocket ride. The for-profits peaked in 2010 at roughly 2 million enrollments (before beginning their spectacular downward spiral shortly thereafter). Not-for-profits (and odd mostly-not hybrids) ramped up the competition. ASU launched its first online 4-year degree in 2006. SNHU started a new online unit in 2009. WGU expanded into Indiana in 2010, which was the same year that Embanet merged with Compass Knowledge and was promptly bought by Pearson. (Wiley acquired Deltak two years later.)
Once again, the more online students you have, the less you are able to tolerate downtime, a poor user interface that drives down productivity, or generic course shells that make it hard to teach students what they need to learn in the ways in which they need to learn. Instructure was founded in 2008. They emphasized a few distinctions from their competitors out of the gate. The first was their native multitentant cloud architecture. Reduced downtime? Check. The second was a strong emphasis on usability. The big feature that they touted which was their early runaway hit was Speed Grader. Increased productivity? Check.
Instructure had found their updraft to give them their hockey stick growth.
But they also emphasized that they were going to be a learning platform. They weren’t going to build out every tool imaginable. Instead, they were going build a platform and encourage others to build the specialized the tools that teachers and students need. And they would aggressively encourage the development and usage of standards to do so. On the one hand, this fit from a cultural perspective. Instructure was more like a Silicon Valley company than its competitors, and platforms were hot in the Valley. On the other hand, it was still a little weird for the education space. There still weren’t good interoperability standards for what they wanted to do. There still hadn’t been an explosion of good learning tools. This is one of those situations where it’s hard to tell how much of their success was prescience and how much of it was luck that higher ed caught up with their cultural inclination at that exact moment.
Co-evolution
The very same year that Brian Whitmer and Devlin Daley founded Instructure, Chuck Severence and Mark Alier were mentoring Jordi Piguillem on a Google Summer of Code project that would become the initial implementation of LTI. In 2010, the same year that Instructure scored its first major win with the Utah Education Network, IMS Global released the final specification for LTI v1.0. All this time that the market had felt like it had been standing still, it had actually been iterating. We just hadn’t been experiencing the benefits of it. Chuck, who had been thinking about interoperability in part through his work on Sakai, had been tinkering. Students like Brian and Devlin, who had been frustrated with their LMS, had been tinkering. The IMS, which actually had a precursor specification before LTI, had been tinkering. While conditions hadn’t become visible on the surface of the glacier, way down, a mile below, the topology of the land was changing.
Meanwhile in Arizona, in 2009, the very first ASU+GSV summit was held. I admit that I have had writer’s block regarding this particular conference the last few years. It has gotten so big that it’s hard to know how to think about it, much less how to sum it up. In 2009, it was an idea. What if a university and a company that facilitates start-ups (in multiple ways) got together to encourage ed tech companies to work more effectively with universities? That’s my retrospective interpretation of the original vision. I wasn’t at many of those early conferences and I certainly wasn’t an insider. It was hard for me, with my particular background, to know what to make of it then and even harder now.
But something clicked for me this year when it turned out that IMS LILI was held at the same hotel that the ASU+GSV summit had been at a couple of months earlier. How does the IMS get to 523 product certifications and $8 million in the bank? A lot of things have to go right for that to happen, but for starters, there have to be 523 products to certify and lots of companies that can afford to pay certification fees. That economy simply did not exist in 2008. Without it, there would be no updraft to ride and consequently no hockey stick growth. ASU+GSV’s phenomenal growth, and the ecosystem that it enabled, was another major factor influenced what I saw at IMS LILI this month.
There is a lot of chicken-and-egg here. LTI made a lot of this possible, and the success LTI (and IMS Global) have experienced would not have been possible without a lot of this. The harder you stare at the picture, the more complicated it looks. This is what “systems thinking” is all about. There isn’t a linear cause-and-effect story. There are multiple interacting feedback loops. It’s a complex adaptive system, which means that it doesn’t respond in linear or predictable ways.
Update: I got a note from Rob Abel noting that a lot of the growth in the last leg came from an explosion of participation in the K12 space. That’s good color and consistent with what I’ve seen in my last couple of LILI conference visits. It’s also consistent with the rest of this analysis. K12 benefitted from all of the dynamics above—the maturation of the LMS market, the dynamics in higher education online that pushed toward SaaS and usability, the massive influx of venture funding, and so on. All of those developments, plus the work inside IMS, made the K12 growth possible, while the dynamics inside K12 added another feedback loop to this complex adaptive system.
But respond it finally did. We have some semblance of a functioning market, and with its rise, blockers preventing the formation of a vibrant interoperability standards ecosystem of the type we have today have largely fallen. Now we have to address the blockers of the formation of the vibrant interoperability ecosystem that we will need tomorrow. Because it will be qualitatively different. Tomorrow’s blockers are not market formation problems but rather collaboration methodology problems. They are about creating meaningful learning learning analytics, which will require solving some wicked problems that can only be tackled through close and well structured interdisciplinary work. That most definitely includes the standards design process itself.
After the glacier comes the flood
What I saw at the IMS LILI this year was, I think, a milestone. The end of an era. Market pressures now favor interoperability. The same companies that were the most resistant to developing and implementing useful interoperability standards in 2007 are among the most aggressive champions of interoperability today. This is not to say that foundational interoperability work is “over.” Far from it. Rather, the conditions finally exist where it can move forward as it should, still hard but relatively unimpeded by the distortions of a dysfunctional market.
That said, the nature and challenges of interoperability our sector will be facing in the next decade are fundamentally different from the ones that we faced in the last one. Up until now, we have primarily been concerned with synchronizing administration-related bits across applications. Which people are in this class? Are they students or instructors? What grades did they get on which assignments? And how much does each assignment count toward the final course grade? These challenges are hard in all the ways that are familiar to anyone who works on any sort of generic data interoperability questions.
But the next decade is is going to be about data interoperability as it pertains to insight. Data scientists think this is still familiar territory and are excited because it keeps them at the frontier of their own profession. But this will not be generic data science, for several reasons. (I will tell you right now that some of them disagree with me on this. Vehemently.) First, even in the most richly instrumented fully online environments that we have today, they are highly data impoverished relative to what we need to make good inferences about teaching and learning. For heaven’s sake, Amazon still recommends things that I have already bought. If I just bought a toaster oven last month, then how likely is it that I want to buy another one now? And I buy everything on Amazon. If they don’t know enough to make good buying recommendations on consumer products, then there’s no way that our learning environments are going to have enough data to make judgements that are orders of magnitude more sophisticated.
Well then, some answer, we’ll just collect more data! More more more! We’ll collect everything! If we collect every bit of data, then we can answer any question. (That is a pretty close paraphrase of what one of the IMS presenters said in one of the handful of learning analytics talks I went to.)
No. You won’t collect “everything”—even if we ignore the obvious, glaring ethical questions—because you don’t know what “everything” is. Computer folks, having finally freed themselves from the shackles of SQL queries and data marts, are understandably excited to apply that newfound freedom to the important problem space of learning. But it is not a good fit, because we don’t have a good understanding of the basic cognitive processes involved in learning. As I wrote about (at length) in a previous post, we have to employ multiple cutting-edge machine learning techniques just to get glimpses of learning processes even when we are directly monitoring students’ brain activity because these are extraordinarily complex processes with multiple hidden variables. Trying to tease out learning processes inside a student’s head based on learning analytics from running machine learning algorithms on LMS data is a little like trying to monitor the digestive processes of a flatworm on the bottom of the Marianas Trench based on studying the wave patterns on the surface of the ocean. There are too many invisible mediating layers to just run a random forest algorithm on your data lake—it all sounds very organic, doesn’t it?—and pop out new insights about how students learn.
That doesn’t mean we should just throw up our hands, by any means. To the contrary, IMS Global has some extraordinarily good tools close at hand for tackling this problem. But it does mean that they are going to have to take some of the stakeholder engagement strategies they’ve been working at diligently to the next level, to the point where the standards-making process itself may evolve over time.
Theory-driven interoperability
There is an excellent data and processing resource that the learning analytics folks have yet to think deeply about how to leverage, as far as I can tell from the conference. The computational power is impressive (and impressively parallel). It is the collective intelligence of educators and learning scientists. Because there are too many confounds to making useful direct inferences from the data, educational inferencing needs to be theory-driven. You need to start with at least some idea of what might be going on inside the learner’s head. One that can be either supported or disproven based on evidence. And you need to know what that evidence might look like. If you can spell all that out, then you can start doing interesting things with learning analytics, including machine learning. There is room for learning science, data science, and on-the-ground teaching expertise at the table. In fact, you need all those kinds of expertise. But the folks with those respective kinds of know-how need to be able to talk to each other and work together in the right ways, which is really hard.
The IMS has an outstanding foundation for this sort of work, because their Caliper specification turns out to provide the basis for a perfectly lovely lingua franca. To begin with, its fundamental structure is triples, which is the same basic idea as the original concept behind the semantic web. If you’re not a computer person and this is starting to make your eye’s glaze over, don’t worry, because this is plain English. Three-word sentences, in fact. Noun, verb, direct object. Student takes test. Question assesses learning objective. Student highlights sentence. Sentence discusses Impressionism.
IMS Caliper expresses learning analytics in statements that can easily be translated into three-word plain-English sentences. These sentences can be strung together into coherent paragraphs. Notice, for example, how the last two example sentences are related. Three-word sentences in this format can be chained together to form longer thoughts. New thoughts. With this one, very simple grammatical structure, we have a language that is generative in the linguistic sense. As long as you have words to put into these grammatical placeholders, you can string thoughts together. Or “chain inferences,” to sling the lingo. And it turns out, unsurprisingly, that Caliper has a mechanism for defining these words in ways that both humans and machines can understand them.
That has to be the bridge. Humans have to understand the utterances well enough to be able express their theories on the front end and understand whatever the machine is telling them it may have learned on the back end. Machines have to understand them specifically enough to be able to parse the sentences in their own, literal, machine-y way. Theoretically, Caliper could be an ideal language to enable educators and computer scientists to discuss theories about how to better support students as well as how to test those theories together.
The challenge is that the IMS community, at least based on what I saw in the sessions I attended, is not using the specification as an interdisciplinary communication tool in this way yet. What I saw happening instead was a lot of very earnest data scientists pumping as much Caliper data as the can into their data lakes. They come to the conference, give a talk and, to their credit, shrug their shoulders and admit that they really don’t know what to do with those data yet. But then they go home and build bigger pipes, because that’s their job. That’s what they do.
It’s not their fault. I’ve been friends with some of these folks for a very long time indeed. There are good people here. But if you work in the IT department, and you’re not a learning scientist or a classroom educator, and the faculty are somewhere between dismissive and disdainful of the idea of talking to you about working together to improve teaching and learning, then what can you do? You do what you know how to do and hope that things will change for the better over time.
It’s not the IMS’s fault either. The conference I attended was called the IMS Learning Impact Leadership Institute. That’s not a new name. Caliper has board that helps guide its direction. That board includes educators who are the kind of advocates that I would like to see on such a body. They are productive irritants in the best possible way. But that’s not enough anymore. This is just a really hard problem. It’s the challenge of the next decade. To meet it, we need to do more than just make sure the right people are in the room together. We need to develop new ways of working together. New roles, methodologies, ways of talking with each other, and ways of seeing the world.
I’m going to preview a bit of a post that I have in my queue for…I’m not sure when, but some time soon…by mentioning “learning engineering.” This term has gotten a lot of buzz lately, along with some criticism. I’ll be writing up my own take on it, but for now I’ll say that one reason I think the term is gaining some currency is that it represents a set of skills for being a mediator in the kind of collaboration that I’m describing here.
As it turns out, it was coined by Nobel prize-winning polymath and Carnegie Mellon luminary Herb Simon, after whom Carnegie Mellon University’s Simon Initiative was named. And, as it also turns out, the Simon Initiative hosted this year’s EEP summit and made some news in the process by contributing $100 million worth of open source software that they use in their research and pratice of…wait for it…learning engineering.
Here’s a slide that they used in their talk explaining what the heck learning engineering is and what they are doing when they are doing it:
Copyright Carnegie Mellon University, CC-BY
(By the way, the videos of all talks from the summit will be posted online, as promised. Please be patient a little longer.)
This post has already run long, so rather than unpacking the slide, I’ll leave you with a question or two. Think about this graphic as representing a data-informed continuous improvement methodology involving multiple people with multiple types of expertise. What would that methodology need to look like? Who would have to be at the table, what kinds of conversations would they have to have, and how would they have to work together?
I’m not suggesting that “learning engineering” is a magical conjuring phrase. But I am suggesting that we need new approaches, new competencies, and likely a new role or two if we are going to get to the next updraft.
Late last week, Carnegie Mellon University (CMU) and Lumen Learning jointly issued a press release announcing their collaboration on an effort to integrate the Lumen-developed RISE analytical framework for curricular materials improvement analysis into the toolkit that Carnegie Mellon announced it will be contributing via open licenses (and unveiling at the Empirical Educator Project (EEP) summit that they are hosting in May).
To be clear, Lumen and Carnegie Mellon are long-time collaborators, and this particular project probably would have happened without either EEP or CMU’s decision to contribute the software that they are now openly licensing. But it is worth talking about in this context for two reasons. First, it provides a great, simple, easy-to-understand example of a subset of the kinds of collaborations we hope to catalyze. And second, it illustrates how CMU’s contribution and the growth of the EEP network can amplify the value of such contributions.
RISE
The RISE framework is pretty easy to understand. RISE stands for Resource Inspection, Selection, and Enhancement. Their focus is on using it to improve Open Educational Resources (OER) because that’s what they do, but there’s nothing about RISE that only works with OER. As long as you have the right to modify the curricular materials you are working with—even if that means removing something proprietary and replacing it with something of your own making—then the RISE framework is potentially useful.
From the paper:
In order to continuously improve open educational resources, an automated process and framework is needed to make course content improvement practical, inexpensive, and efficient. One way that resources could be programmatically identified is to use a metric combining resource use and student grade on the corresponding outcome to identify whether the resource was similar to or different than other resources. Resources that were significantly different than others can be flagged for examination by instructional designers to determine why the resource was more or less effective than other resources. To achieve this, we propose the Resource Inspection, Selection, and Enhancement (RISE) Framework as a simple framework for using learning analytics to identify open educational resources that are good candidates for improvement efforts.
The framework assumes that both OER content and assessment items have been explicitly aligned with learning outcomes, allowing designers or evaluators to connect OER to the specific assessments whose success they are designed to facilitate. In other words, learning outcome alignment of both content and assessment is critical to enabling the proposed framework. Our framework is flexible regarding the number of resources aligned with a single outcome and the number of items assessing a single outcome.
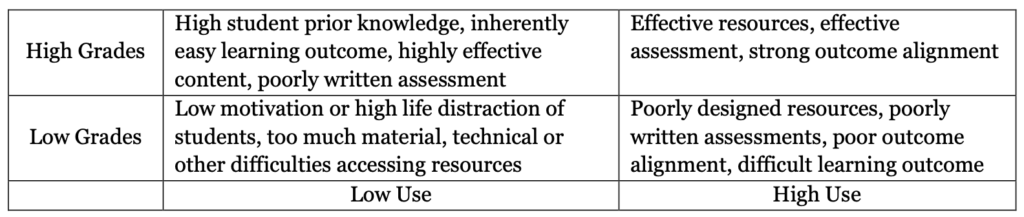
The framework is composed of a 2 x 2 matrix. Student grade on assessment is on the y-axis. The x-axis is more flexible, and can include resource usage metrics such as pageviews, time spent, or content page ratings. Each resource can be classified as either high or low on each axis by splitting resources into categories based on the median value. By locating each resource within this matrix, we can examine the relationship between resource usage and student performance on related assessments. In Figure 2, we have identified possible reasons that may cause a resource to be categorized in a particular quadrant using resource use (x-axis) and grades (y-axis).
Figure 2. A partial list of reasons OER might receive a particular classification within the RISE framework.
By utilizing this framework, designers can identify resources in their courses that are good candidates for additional improvement efforts. For instance, if a resource is in the High Use, High Grades quadrant, it may act as a model for other resources in the class. If a resource falls into the Low Use, Low Grades quadrant, it may warrant further evaluation by the designers to understand why students are ignoring it or why it is not contributing to student success. The goal of the framework is not to make specific design recommendations, but to provide a means of identifying resources that should be evaluated and improved.
Let’s break this down.
RISE is designed to work with a certain type of common course design, where content and assessment items are both aligned to learning objectives. This design paradigm doesn’t work for every course, but it works for many courses. The work of aligning the course content and assessment questions with specific learning objectives is intended to pay dividends in terms of helping the course designers and instructors gain added visibility into whether their course design is accomplishing what it was intended to accomplish. The 2×2 matrix in the RISE paper captures this value rather intuitively. Let’s look at it again:
Each box captures potential explanations that would be fairly obvious candidates to most instructors. For example, if students are spending a lot of time looking at the content but still scoring poorly on related test questions, some possible explanations are that (1) the teaching content is poorly designed, (2) assessment questions are poorly written, or (3) the concept is hard for students to learn. There may be other explanations as well. But just seeing the correlation that students are spending a lot of time on particular content are still doing poorly on particular related assessment learning questions leads the instructor and the content designer (who may or may not be the same person) to ask useful questions. And then there is some craft at the end about thinking through how to deal with the content that has been identified as potentially problematic.
This isn’t magic. It’s not a robot tutor in the sky. In fact, it’s almost the antithesis. It’s so sensible that it verges on boring. It’s hygiene. Everybody who teaches with this kind of course design should regularly tune those courses in this way, as should everybody who builds courses that are designed this way. But that’s like saying everybody should brush their teeth at least twice a day. It’s not sexy.
Also, easy to understand and easy to do are two different things. Even assuming that your curricular materials are designed this way and that you have sufficient rights to modify them, different courses live in different platforms. While you don’t need to get a lot of sophisticated data to do this analysis—just basic Google Analytics-style page usage and item-level assessment data—it will take a little bit of technical know-how, and the details will be different on each platform. Once you have the data, you will then need to be able to do a little statistical analysis. There isn’t much math in this paper and what little there is isn’t very complicated, but it is still math. Not everybody will feel comfortable with it.
The typical way the sector has handled this problem has been to put pressure on vendors as consumers to add this capability as a feature to their products. But that process is slow and uncertain. Worse, each vendor will likely implement the feature slightly differently and non-transparently, which creates a greater challenge for the last point of friction. Features like this require a little bit of literacy to use well. Everybody knows the mantra “correlation is not causation,” but it is better thought of as the closest thing that Western scientific thinking can get to Zen koan. ((Outside of quantum mechanics, at least.)) If you think you’ve plumbed the depths of meaning of that phrase, then you probably haven’t. If we want educators to understand both the value and the limitations of working with data, then they need to have absolute clarity and consistency regarding what those analytics widgets are telling them. Having ten widgets in different platforms telling them almost but not quite the same things in ways that are hard to differentiate will do more harm than good.
And this is where we fail.
While the world is off chasing robot tutors and self-driving cars, we are leaving many, many tools like RISE just lying on the floor, unused and largely unusable, for the simple reason that we have not taken the extra steps necessary to make them easy enough and intuitive enough for non-technical faculty to adopt. And by tools, I mean methods. This isn’t about technology. It’s about literacy. Why should we expect academics, of all people, to trust analytical methods that nobody has bothered to explain to them? They don’t need to understand how to do the math, but they do need to understand what the math is doing. And they need to trust that somebody that they trust is verifying that the math is doing what they think it is doing. They need to know that peer review is at work, even if they are not active participants in it.
Making RISE shine
This is where CMU’s contribution and EEP can help. LearnSphere is the particular portion of the CMU contribution into which RISE will be integrated. I use the word “portion” because LearnSphere itself is a composite project consisting of a few different components that CMU collectively describes as “a community data infrastructure to support learning improvement online.” I might alternatively describe it as a cloud-based educational research collaboration platform. It is probably best known for its DataShop component, which is designed to share research learning research data sets.
One of the more recent but extremely interesting additions to LearnSphere is called Tigris, which provides a separate research workflow layer. Suppose that you wanted to run a RISE analysis on your course data, in whatever platform it happens to be in. Lumen Learning is contributing the statistical programming package for RISE that will be imported into Tigris. If you happen to be statistically fluent, you can open up that package and inspect it. If you aren’t technical, don’t worry. You’ll be able to grab the workflow using drag-and-drop, import your data, and see the results.
Again, this kind of contribution was possible before CMU decided to make its open source contribution and before EEP existed. They have been cloud hosting LearnSphere for collaborative research use for some time now.
But now they also have an ecosystem.
By contributing so much under open license, along with the major accompanying effort to make that contribution ready for public consumption, CMU is making massive declaration to the world about their seriousness regarding research collaboration. It is a magnet. Now Lumen Learning’s contribution isn’t simply an isolated event. It is an early leader with more to come. Expect more vendors to contribute algorithms and to announce data export compatibility. Expect universities to begin adopting LearnSphere, either via CMU’s hosted instance or their own instance, made possible the full stack being released under an open source license. This will start with the group that will gather at the EEP summit at CMU on May 6th and 7th, because one has to start somewhere. That is the pilot group. But it will grow. (And LearnSphere is only part of CMU’s total contribution.)
With this kind of an ecosystem, we can create an environment in which practically useful innovations can spread much more quickly (and cheaply) which vendors regardless of size or marketing budget can be rewarded in the marketplace based on their willingness to make practical contributions of educational tools and methods that can be useful to customers and non-customers alike. Lumen Learning has made a contribution with the RISE research. They now want to make a further contribution to make that research more practically useful to customers and non-customers alike. CMU’s contributed infrastructure and the EEP network will give us an opportunity reward that kind of behavior with credit and attention.
Just that first sentence shows how much meat there is yet to be put on the bones. “Contribution?” “Democratize learning science?” What does all that mean? These are fair questions. Jeff Young has some good reporting up at EdSurge that connects some dots on what’s public so far. I’m going to do my best to explain why the answers are not yet as clear as they might be, when and how they will be come clearer, and then give some reminders of past conversations here on e-Literate that provide some breadcrumbs leading in the direction of where all this is going. There will be more news in the press that will drop on Wednesday, followed by some more analysis by me on Thursday. From there, the story will build in pieces, through the Empirical Educator summit on May 6th and 7th, and afterward.
Let’s start with the big picture. Carnegie Mellon has been a pioneer in various types of theoretical and applied educational and cognitive science research—which is now fashionable to roll up into a ball and call “learning science”—for decades. While their work often doesn’t get the publicity it deserves, the breadth and depth is astounding. I’ve had the privilege of visiting a few times and taking deep dives. ((When I say deep, I mean deep. See, for example, https://mfeldstein.wpengine.com/can-there-be-microscope-of-mind/.)) There are very few institutions in the world that are in their league in terms of the scope of what they do.
The university made a decision to take a lot of their work product—over $100 million worth, in fact—and make it broadly accessible to the academic community. Honoring this commitment in a real and practical way is…hard. Very, very hard. It’s about more than just releasing the source code to software, which is hard enough to do right in and of itself. This is about making science—not just the output but the practice—accessible and useful to non-scientist educators. On top of that, the components of the contribution were not all designed together as a single software platform. They consist of many research projects, developed by different teams and that may be more loosely or tightly related to each other. Imagine if a top research laboratory decided to turn itself into the Smithsonian Institution, making itself a hands-on science museum accessible to everyone without dumbing itself down. That’s not exactly the goal that Carnegie Mellon’s Simon Initiative has set for itself, but its’ the same spirit. It’s incredibly ambitious and not easily imagined, much less described in a single press release.
In fact, doing this well is itself going to take some empirical experimentation. And that’s where the partnership with the Empirical Educator Project comes in. Carnegie Mellon had already offered to host this year’s summit on May 6th and 7th. I’m honestly not sure how long they’ve been mulling over this idea of the giant release, but at some point they came to the conclusion that we would be good pilot partners for their effort. This week, we will be describing our high-level approach to our pilot design for helping to make CMU’s contribution accessible. And not just CMU’s contribution, either, since EEP is based on the premise that many academic institutions have innovations to contribute if only we can get better at sharing them. The scale of CMU’s contribution has given us an opportunity to challenge our assumptions about how we should be going about this work. It’s a once-in-a-lifetime opportunity.
As I said, more details while emerge in the coming days, weeks, and months, first as we learn how to tell such a big story and later as we learn from the grand experiment as it unfolds. For now, I want to leave you with two video playlists. The first is a set of interviews of Carnegie Mellon faculty that I recorded while visiting a few years ago. At the time, I had no agenda other than to capture their individual and collective views on “learning science” and its relationship to classroom teaching. The second is a set of interviews from participants after the first day of the first EEP summit. Taken together, I think you will see why there is a good fit.