e-Literate

Present is Prologue

Tag: Blackboard

  • Year-end Updates on e-Literate News Posts

    For my final 2014 post, I thought it would be interesting to provide year-end updates to some news posts on e-Literate over the past year. You’ll notice that there is somewhat of an emphasis on negative stories or implications. For most positive stories, companies and institutions are typically all too happy to send out press releases with the associated media paraphrasing, and we have little need here to cover as news. The following non-exhaustive list is in date order.

    D2L Growth Claims

    In December 2013 I described layoffs at Desire2Learn (now officially named D2L). The significance of this story is that it calls into question D2L’s growth claims and trumpeting of massive new investment of $85 million. Some updates:

    IPEDS Data on Online Learning

    (more…)

  • e-Literate Top 20 Posts For 2014

    I typically don’t write year-end reviews or top 10 (or 20) lists, but I need to work on our consulting company finances. At this point, any distraction seems more enjoyable than working in QuickBooks.

    We’ve had a fun year at e-Literate, and one recent change is that we are now more willing break stories when appropriate. We typically comment on ed tech stories a few days after the release, providing analysis and commentary, but there are several cases where we felt a story needed to go public. In such cases (e.g. Unizin creation, Cal State Online demise, management changes at Instructure and Blackboard) we tend to break the news objectively, providing mostly descriptions and explanations, allowing others to provide commentary.

    The following list is based on Jetpack stats on WordPress, which does not capture people who read posts through RSS feeds (we send out full articles through the feed). So the stats have a bias towards people who come to e-Literate for specific articles rather than our regular readers. We also tend to get longer-term readership of articles over many months, so this list also has a bias for articles posted a while ago.

    With that in mind, here are the top 20 most read articles on e-Literate in terms of page views for the past 12 months along with publication date.

    1. Can Pearson Solve the Rubric’s Cube? (Dec 2013) – This article proves that people are willing to read a 7,000 word post published on New Year’s Eve.
    2. A response to USA Today article on Flipped Classroom research (Oct 2013) – This article is our most steady one, consistently getting around 100 views per day.
    3. Unizin: Indiana University’s Secret New “Learning Ecosystem” Coalition (May 2014) – This is the article where we broke the story about Unizin, based largely on a presentation at Colorado State University.
    4. (more…)

  • Blackboard’s SVP of Product Development Gary Lang Resigns

    Gary Lang, Blackboard’s senior vice president in charge of product development and cloud operations, has announced his resignation and plans to join Amazon. Gary took the job with Blackboard in June 2013 and, along with CEO Jay Bhatt and SVP of Product Management Mark Strassman, formed the core management team that had worked together previously at AutoDesk. Gary led the reorganization effort to bring all product development under one organization, a core component of Blackboard’s recent strategy.

    Michael described Blackboard’s new product moves toward cloud computing and an entirely new user experience (UX) for the Learn LMS, and Gary was the executive in charge of these efforts. These significant changes have yet to fully roll out to customers (public cloud in pilot, new UX about to enter pilot). Gary was also added to the IMS Global board of directors in July 2014 – I would expect this role to change as well given the move to Amazon. (more…)

  • State of the US Higher Education LMS Market: 2014 Edition

    I shared the most recent graphic summarizing the LMS market in November 2013, and thanks to new data sources it’s time for an update. As with all previous versions, the 2005 – 2009 data points are based on the Campus Computing Project, and therefore is based on US adoption from non-profit institutions. This set of longitudinal data provides an anchor for the summary.

    The primary data source for 2013 – 2014 is Edutechnica, which not only does a more direct measurement of a larger number of schools (viewing all schools in IPEDS database with more than 800 FTE enrollments), but it also allows scaling based on enrollment per institution. This means that the latter years now more accurately represent how many students use a particular LMS.

    A few items to note:

    • Despite the addition of the new data source and its inclusion of enrollment measures, the basic shape and story of the graphic have not changed. My confidence has gone up in the past few years, but the heuristics were not far off.
    • The 2013 inclusion of Anglosphere (US, UK, Canada, Australia) numbers caused more confusion and questions than clarity, so this version goes back to being US only.
    • The Desire2Learn branding has been changed to Brightspace by D2L.
    • The eCollege branding has been changed to Pearson LearningStudio.
    • There is a growing area of “Alternative Learning Platforms” that includes University of Phoenix, Coursera, edX and OpenEdX, 2U, Helix and Motivis (the newly commercialized learning platform from College for America).
    • While the data is more solid than 2012 and prior years, keep in mind that you should treat the graphic as telling a story of the market rather than being a chart of exact data.

    LMS_MarketShare_20141107

    Some observations of the new data taken from the post on Edutechnica from September:

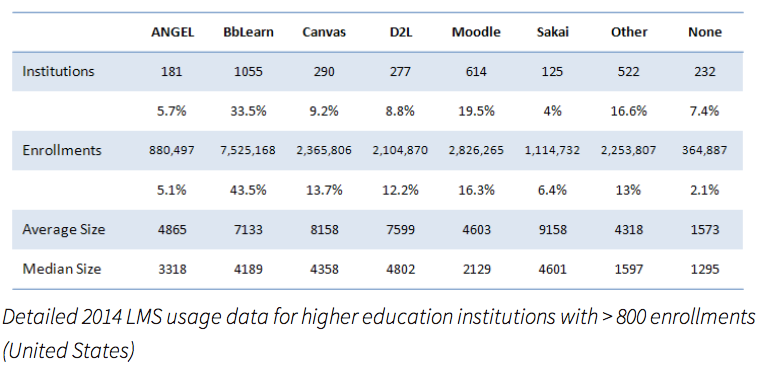
    • Blackboard’s BbLearn and ANGEL continue to lose market share in US -[1] Using the 2013 to 2014 tables (> 2000 enrollments), BbLearn has dropped from 848 to 817 institutions and ANGEL has dropped from 162 to 123. Using the revised methodology, Blackboard market share for > 800 enrollments now stands at 33.5% of institutions and 43.5% of total enrollments.
    • Moodle, D2L, and Sakai have no changes in US – Using the 2013 to 2014 tables (> 2000 enrollments), D2L has added only 2 schools, Moodle none, and Sakai 2 schools.
    • Canvas is the fasted growing LMS and has overtaken D2L – Using the 2013 to 2014 tables (> 2000 enrollments), Canvas grew ~40% in one year (from 166 to 232 institutions). For the first time, Canvas appears to have have larger US market share than D2L (13.7% to 12.2% of total enrollments using table above).
  • New LMS Market Data: Edutechnica provides one-year update

    In Fall 2013 we saw a rich source of LMS market data emerge.

    George Kroner, a former engineer at Blackboard who now works for University of Maryland University College (UMUC), has developed what may be the most thorough measurement of LMS adoption in higher education at Edutechnica (OK, he’s better at coding and analysis than site naming). This side project (not affiliated with UMUC) started two months ago based on George’s ambition to unite various learning communities with better data. He said that he was inspired by the Campus Computing Project (CCP) and that Edutechnica should be seen as complementary to the CCP.

    The project is based on a web crawler that checks against national databases as a starting point to identify the higher education institution, then goes out to the official school web site to find the official LMS (or multiple LMSs officially used). The initial data is all based on the Anglosphere (US, UK, Canada, Australia), but there is no reason this data could not expand.

    There is new data available in Edutechnica’s one-year update, with year-over-year comparisons available as well as improvements to the methodology. Note that the methodology has improved both in terms of setting the denominator and in terms of how many schools are included in the data collection.

    The Fall 2014 data which now includes all schools with more than 800 enrollments:

    (more…)

  • InstructureCon: Canvas LMS has different competition now

    For the first few years of the Canvas LMS, Instructure’s core message was ‘Canvas is better than Blackboard’. This positioning was thinly veiled in the company’s 2011 spoof of the Apple / 1984 commercial and even hitting the level of gloating in a company blog commenting on Blackboard’s strategy reversal in 2012. Instructure made their name by being the anti-Blackboard.

    At InstructureCon 2014, there was hardly a mention of Blackboard or any of the other LMS providers. In fact, most of the general sessions avoided any direct or indirect comparison of LMS products. This year there were three observations that surprised me:

    • Snow in June;
    • Canvas growth in K-12 markets; and
    • Lack of mention of LMS competitors or product one-upmanship.

    Snow in June

    (more…)

  • ITC Survey: Four trends to watch in LMS market for community colleges

    The Instructional Technology Council (ITC), an affiliated council of the American Association of Community Colleges (AACC), has conducted a distance education survey since 2004 focusing on online education trends among community colleges in the US and Canada. With this focus, the member colleges tend to be those with a stronger interest in online education programs and therefore are more progressive in technology usage than the general community college population. One part of the ITC survey is on general LMS usage at member schools, and this provides another source of data on the higher ed LMS market.

    The survey this year was based on 142 responses out of the 375 member institutions (39%), and there are a few caveats that should be noted:

    • Prior to 2012 the survey was emailed to all AACC colleges, but due to uneven responses the survey changed to just survey ITC colleges; and
    • “No answer” responses are not listed in percentages, thus totals will not always equal 100%.

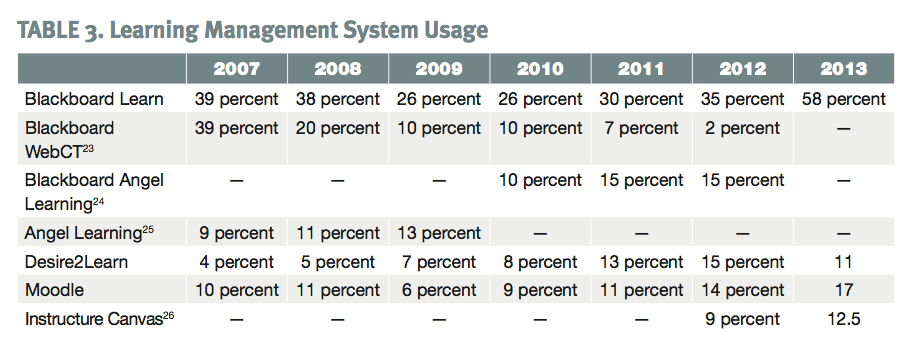
    Despite those caveats, “70 percent of the annual submissions have come from the same campuses during the nine years of the survey”, which means that it is worth exploring some broad trends for the LMS market for community colleges. Here is the data presented on LMS usage this year on page 15 (April 2014 report of Fall 2013 survey data):

    Table 3


    (more…)