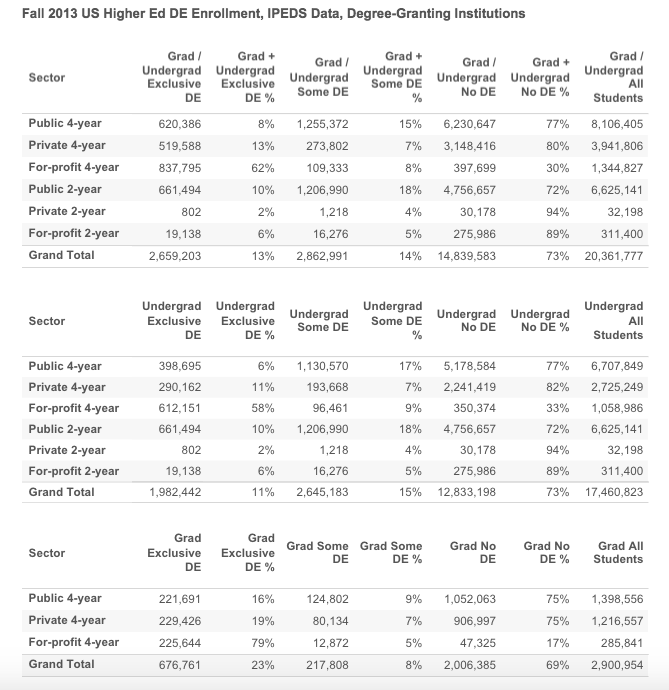
The National Center for Educational Statistics (NCES) and its Integrated Postsecondary Education Data System (IPEDS) provide the most official data on colleges and universities in the United States. Last year they released data on distance education (essentially online courses) starting with the Fall 2012 term. Last week they released new data for the Fall 2013 term. Below is a profile of online education in the US for degree-granting colleges and university, broken out by sector and for each state.
Please note the following:
- For the most part distance education and online education terms are interchangeable, but they are not equivalent as DE can include courses delivered by a medium other than the Internet (e.g. correspondence course).
- I have provided some flat images as well as an interactive graphic at the bottom of the post. The interactive graphic has much better image resolution than the flat images.
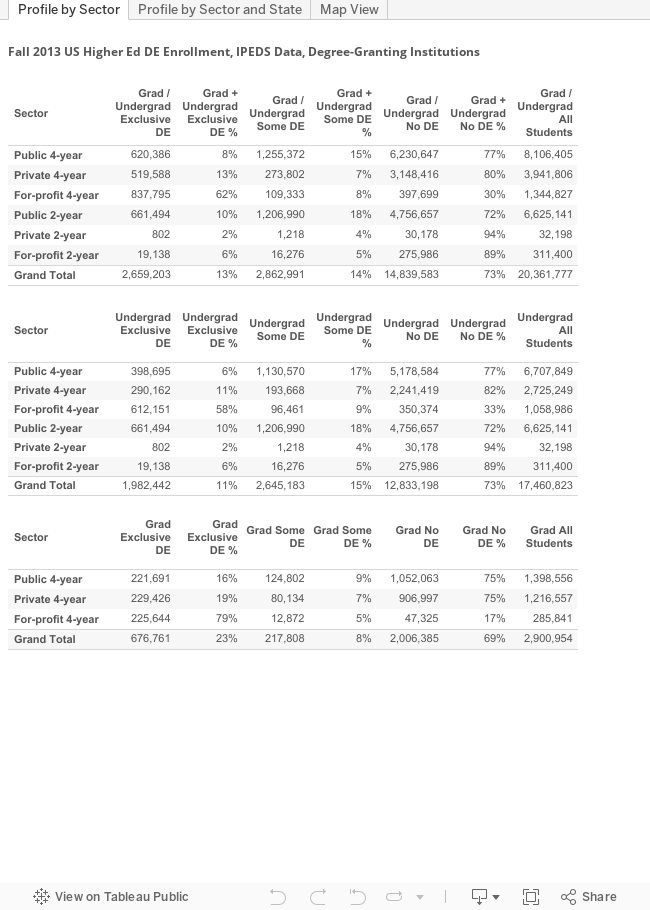
- There are three tabs below in the interactive graphic – the first shows totals for the US by sector and by level (grad, undergrad); the second also shows the data for each state; the third shows a map view.
- Please note that along with Russ Poulin from WCET we have identified some significant problems with IPEDS data validity – see this article for more information.
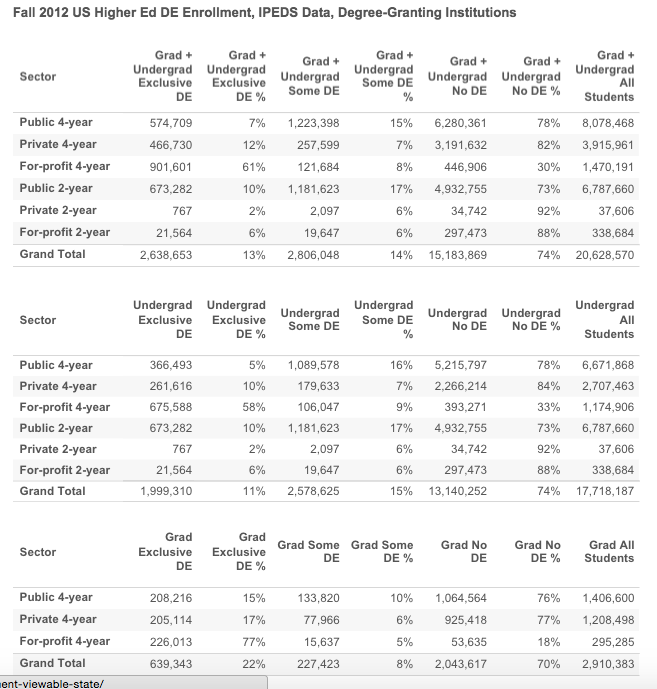
By way of comparison, it is worth noting the similarities to the Fall 2012 data. The percentage data (e.g. percent of a sector taking exclusive / some / no DE courses) has not changed by more than 1% (rounded) in any of the data. This unfortunately makes the problems with IPEDS data validity all the more important.
It will be very interesting to see the Babson Survey Research Group data that is typically released in January. While Babson relies on voluntary survey data, as opposed to mandatory federal data reporting for IPEDS, their report should have better longitudinal validity. If this IPEDS data holds up, then I would expect the biggest story for this year’s Babson report to be the first year of no significant growth in online education since the survey started 15 years ago.
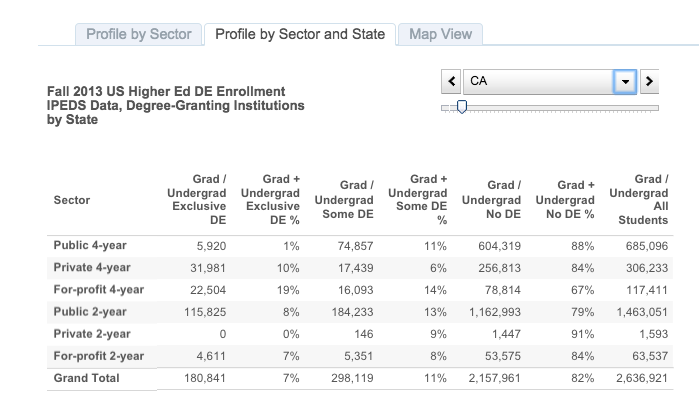
If you select the middle tab, you can view the same data for any selected state. As an example, here is data for California.
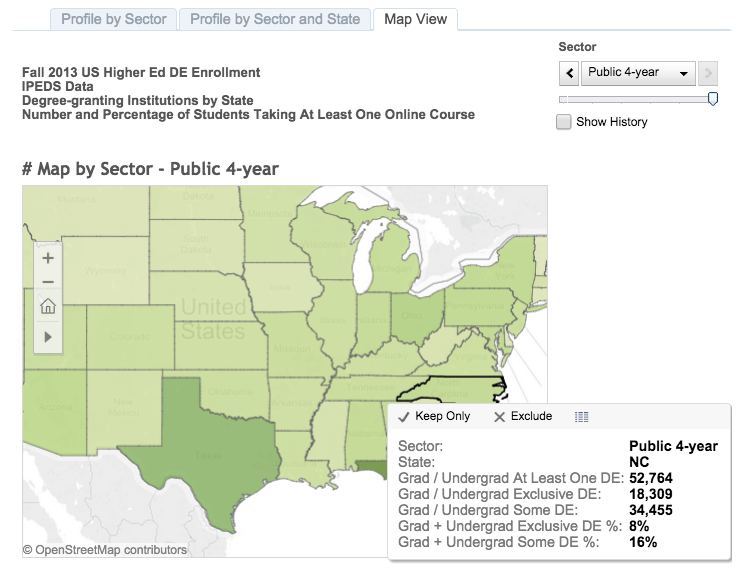
There is also a map view of state data colored by number of, and percentage of, students taking at least one online class for each sector. If you hover over any state you can get the basic data. As an example, here is a view highlighting North Carolina public 4-year institutions.
Interactive Graphic
For those of you who have made it this far, here is the interactive graphic. Enjoy the data.
[…] The National Center for Educational Statistics (NCES) and its Integrated Postsecondary Education Data System (IPEDS) provide the most official data on colleges and universities in the United States. Last year they released data on distance education (essentially online courses) starting with … Continue reading → […]