e-Literate

Present is Prologue

Tag: Online Education

  • Fall 2016 Top 20 Largest Online Enrollments In US – With Trends Since 2012

    Fall 2016 Top 20 Largest Online Enrollments In US – With Trends Since 2012

    The National Center for Educational Statistics (NCES) and its Integrated Postsecondary Education Data System (IPEDS) provide the most official data on colleges and universities in the United States. This is the fifth year of data, and we have an opportunity to view trends over time.

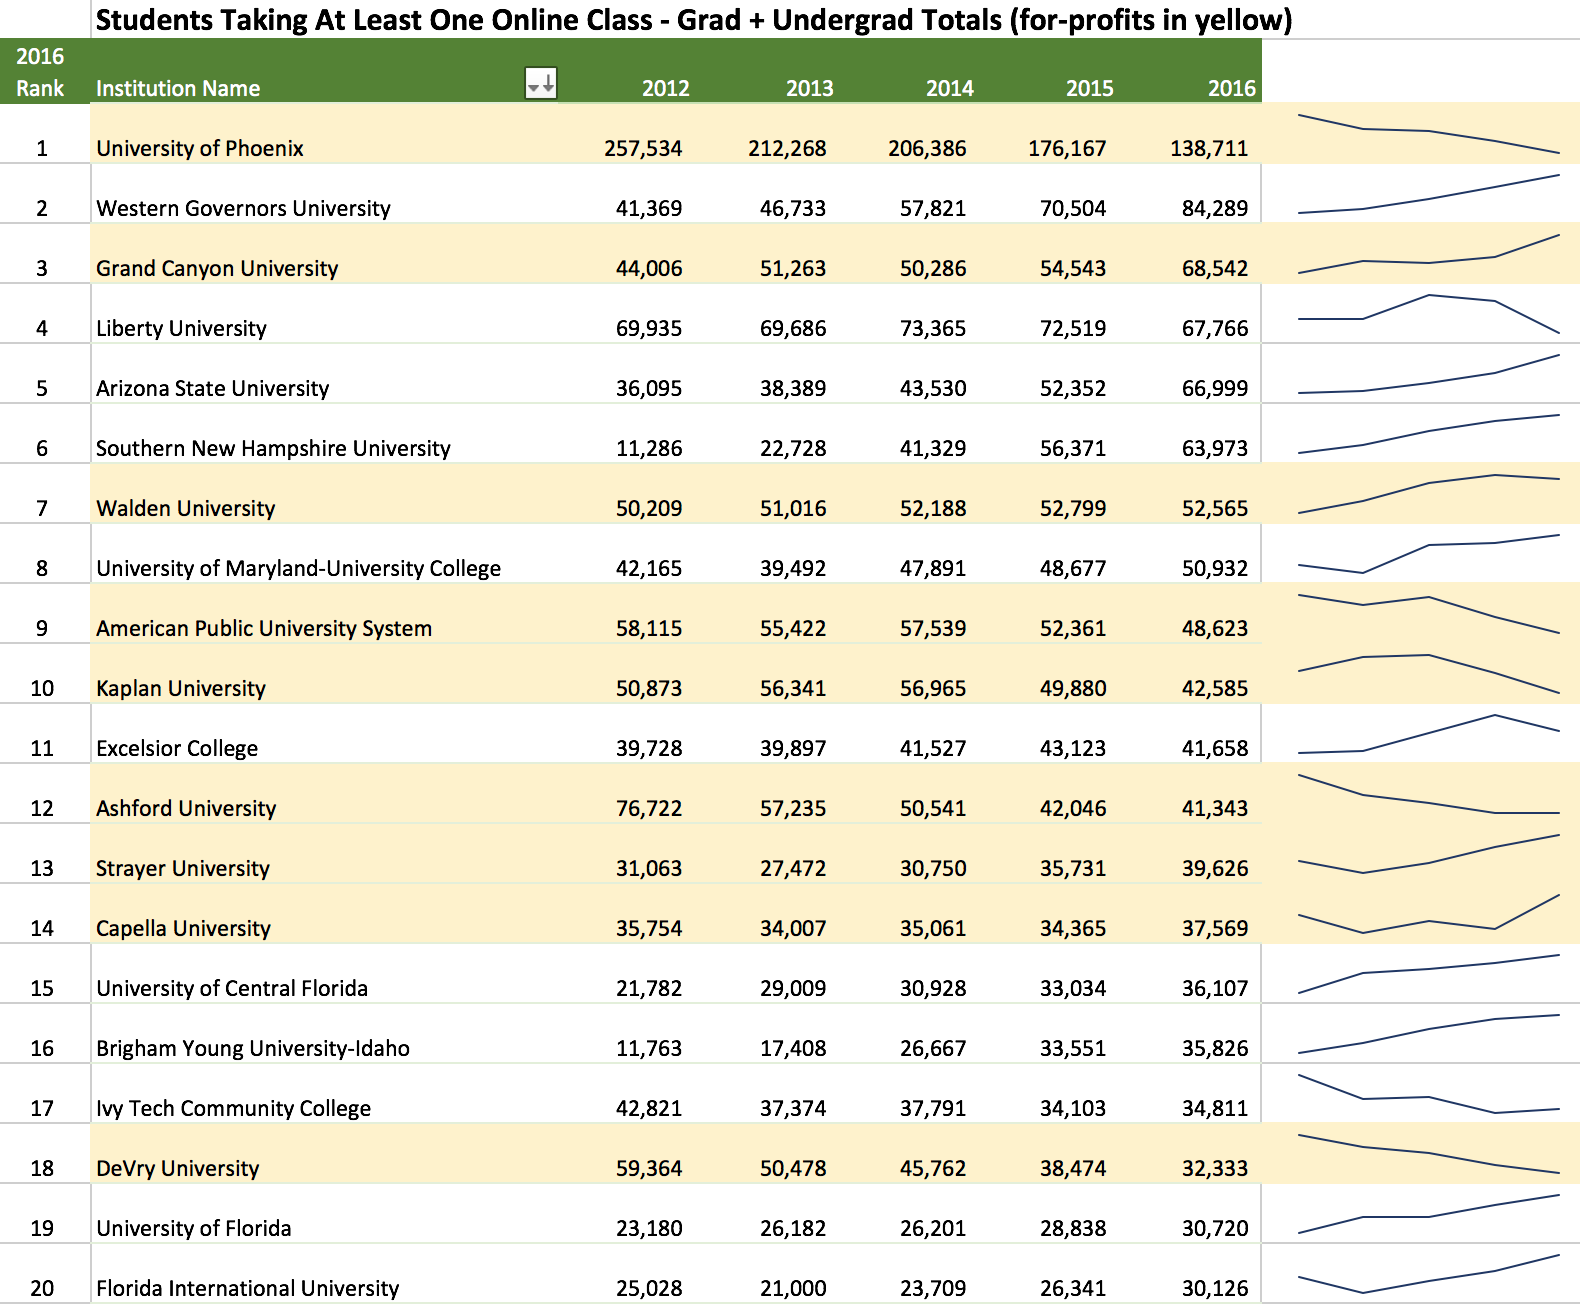
    Let’s look at the top 20 online programs for Fall 2016 (in terms of total number of students taking at least one online course for grad and undergrad levels combined) in the US. Some notes on the data source:

    • I have combined the categories ‘students exclusively taking distance education courses’ and ‘students taking some but not all distance education courses’ to obtain the ‘at least one online course’ category;
    • IPEDS tracks data based on the accredited body, which can differ for systems – I manually combined most for-profit systems into one institution entity as well as Arizona State University;
    • I have highlighted for-profit institutions in yellow and added sparklines to help visualize trends;
    • See this post for Fall 2016 profile by sector and state.

    Top 20 Online Enrollment in US

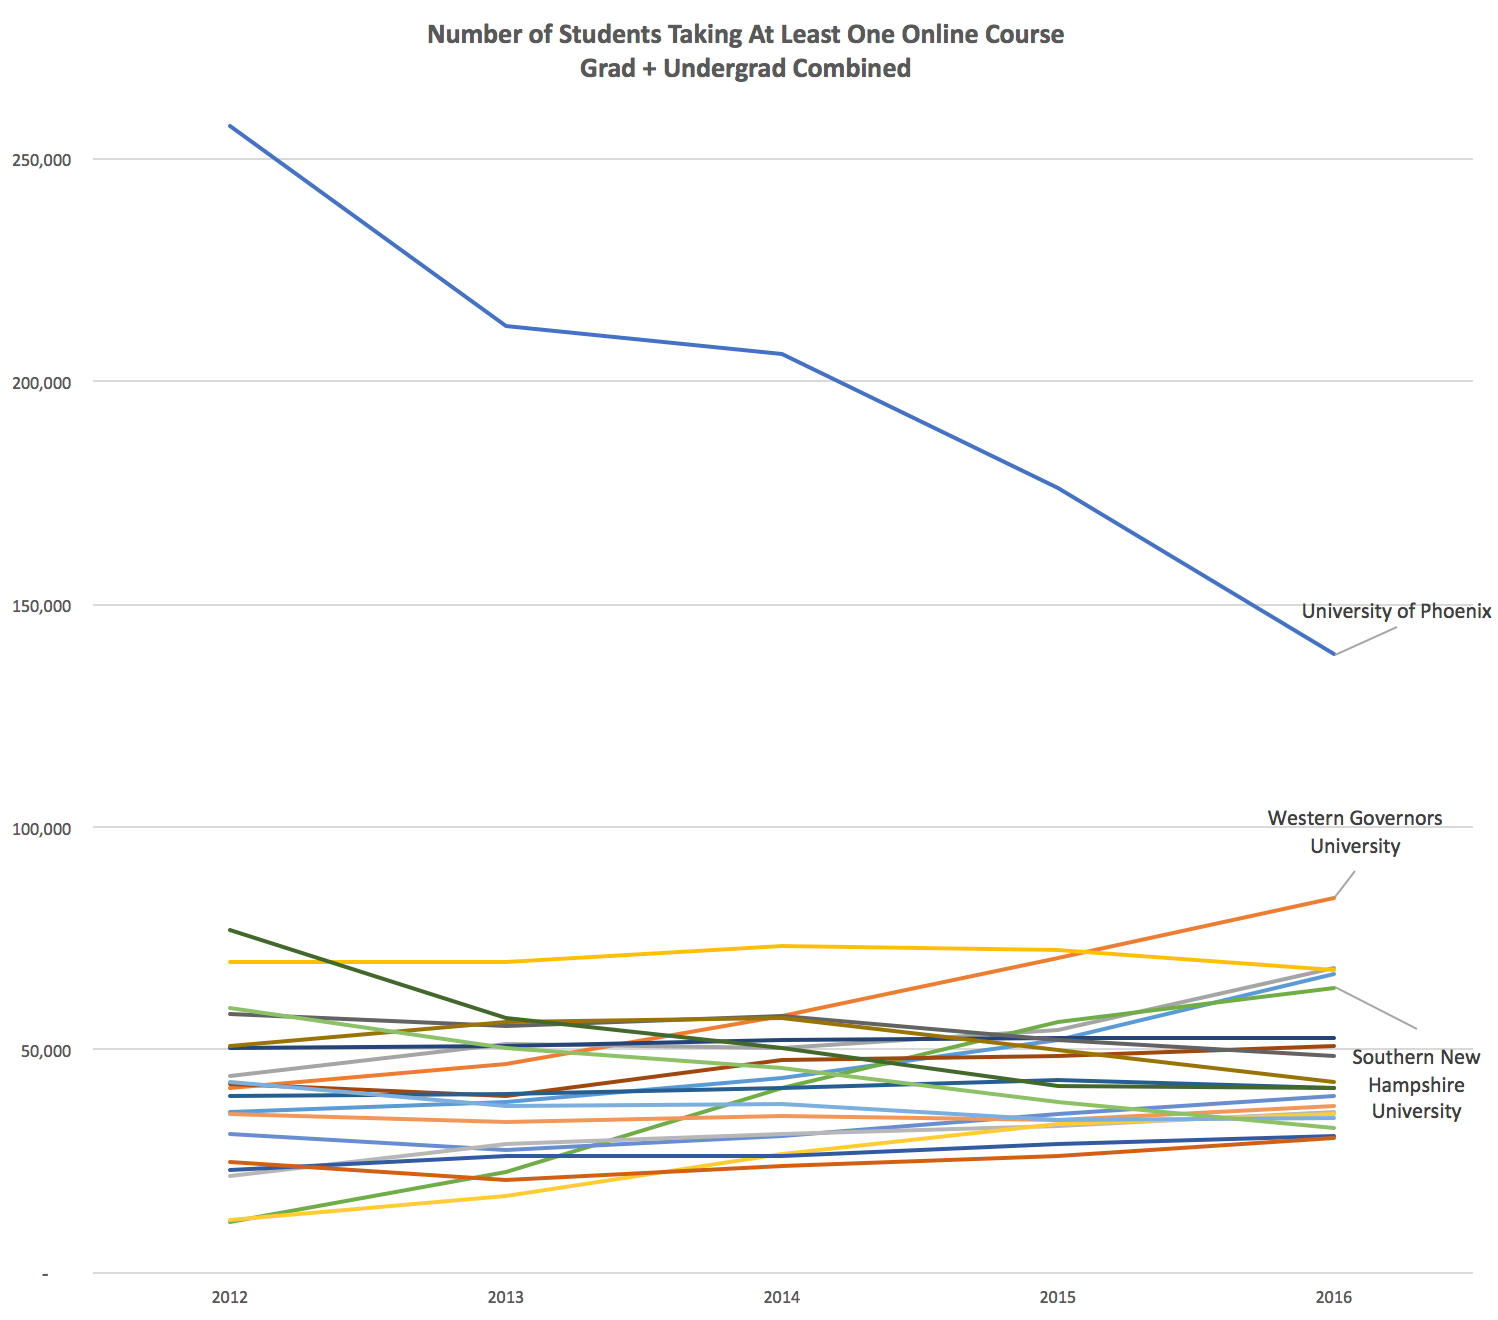
    One additional trend to capture is the dramatic change in the (previous) dominance of the University of Phoenix for overall and online enrollment. For perspective I have also labeled Western Governors University and Southern New Hampshire University.

    Top 20 Online Enrollment 2012 thru 2016

  • Fall 2016 IPEDS Data: New Profile of US Higher Ed Online Education

    Fall 2016 IPEDS Data: New Profile of US Higher Ed Online Education

    The National Center for Educational Statistics (NCES) and its Integrated Postsecondary Education Data System (IPEDS) provide the most official data on colleges and universities in the United States. I have been analyzing and sharing the data since the inaugural Fall 2012 dataset.

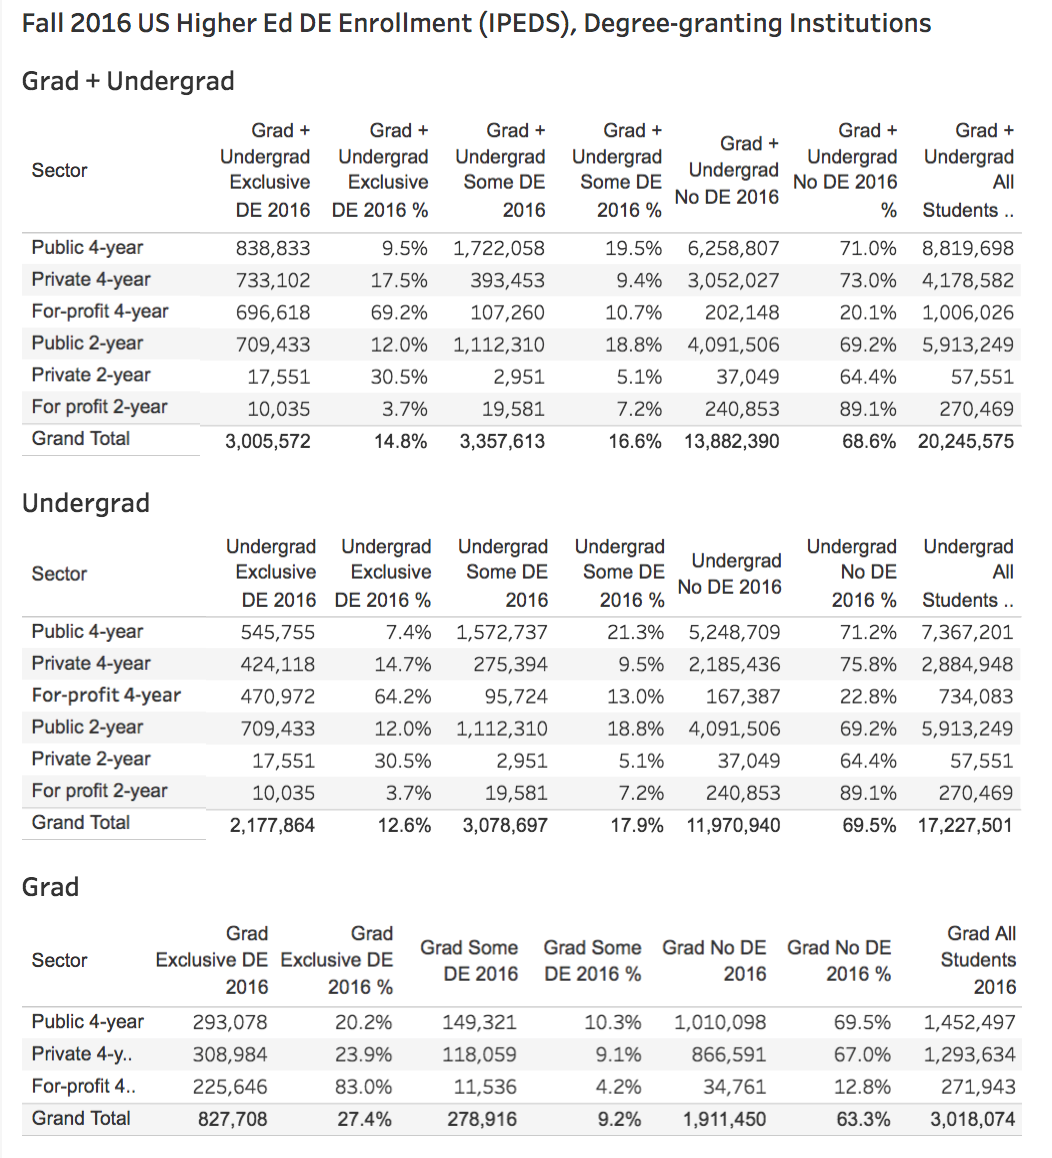
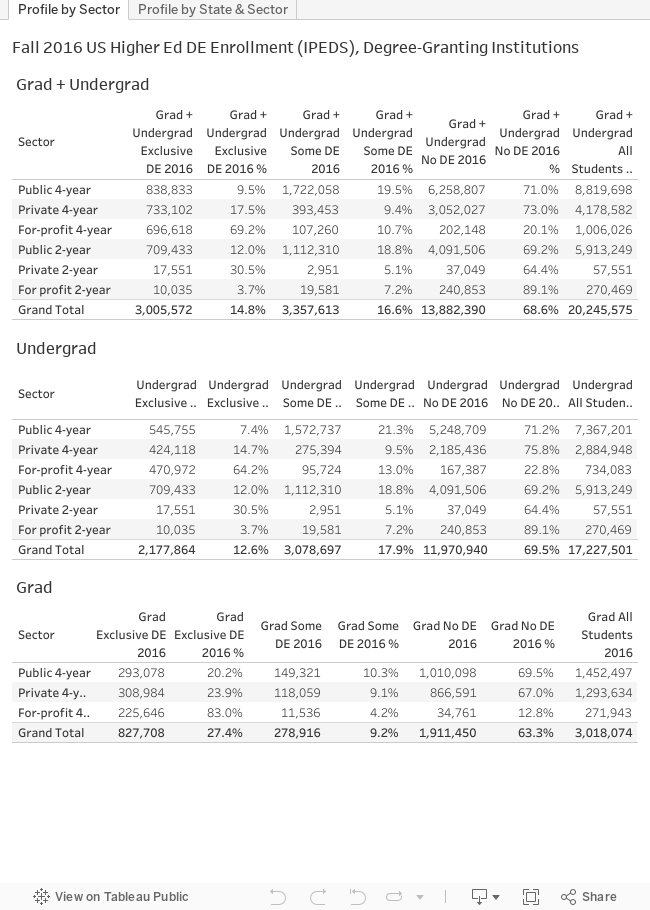
    Below is a profile of online education in the US for degree-granting colleges and university, broken out by sector and for each state.

    Please note the following:

    • For the most part distance education and online education terms are interchangeable, but they are not equivalent as DE can include courses delivered by a medium other than the Internet (e.g. correspondence course).
    • I have provided some flat images as well as an interactive graphic at the bottom of the post. The interactive graphic has much better image resolution than the flat images.
    • There are two tabs below in the interactive graphic – the first shows totals for the US by sector and by level (grad, undergrad); the third shows a map view allowing filtering by sector.

    Table of DE enrollments

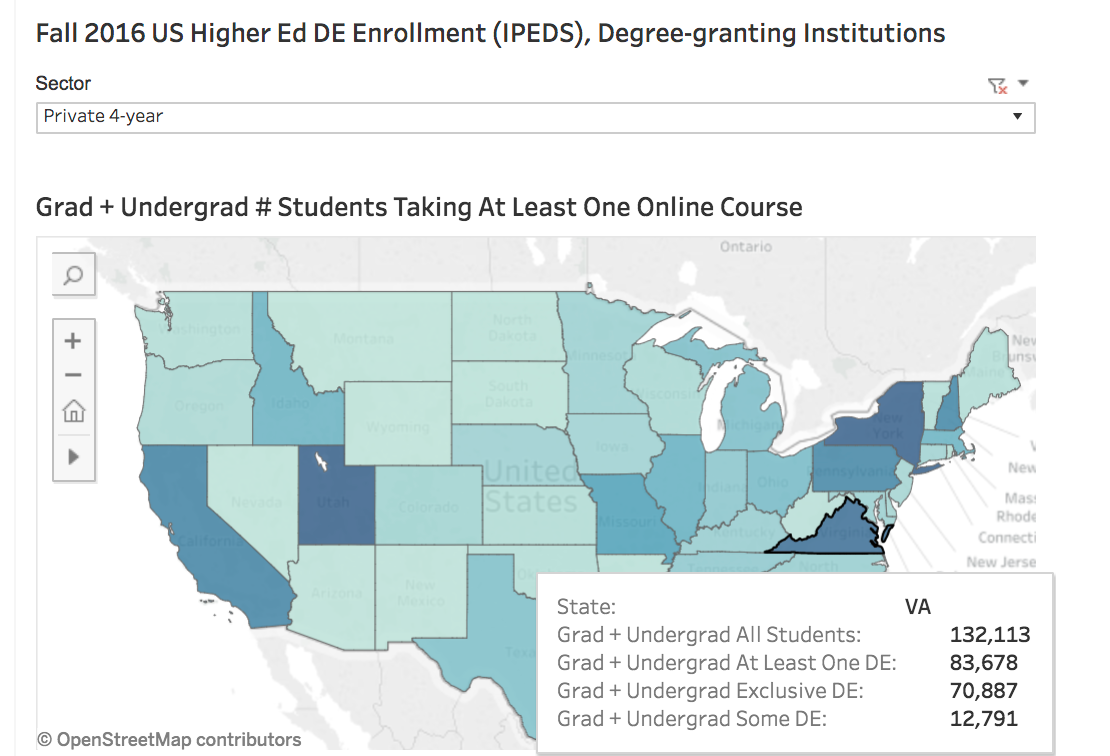
    There is also a map view of state data colored by number of, and percentage of, students taking at least one online class for each sector. If you hover over any state you can get the basic data. As an example, here is a view highlighting Virginia private 4-year institutions.

    State map view of DE enrollments

    Interactive Graphic

    For those of you who have made it this far, below is the interactive graphic, which can also be found here. Enjoy the data.

  • Fall 2016 IPEDS First Look: Continued growth in distance education in US

    Fall 2016 IPEDS First Look: Continued growth in distance education in US

    The National Center for Educational Statistics (NCES) just released its Integrated Postsecondary Education Data System (IPEDS) report and data on postsecondary enrollment in the US for the Fall 2016 term. This federal data has been tracking distance education (DE) since Fall 2012, and with the new release we get our first look at trends through last year. Accompanying the data is a report by NCES with summary data tables. For the following tables and chart, I took the same approach as the report, by simply filtering for US-only institutions participating in Title IV federal financial aid programs.

    Please note that this is a broader definition, with more schools included, that our previous analysis at e-Literate and the Digital Learning Compass report. Those posts and analysis further filter for 2-year and 4-year degree-granting institutions.

    When viewing data from this first look at 6,677 institutions and administrative units, please note the following:

    • For the most part distance education and online education terms are interchangeable, but they are not equivalent as DE can include courses delivered by a medium other than the Internet (e.g. correspondence course).
    • Exclusively DE means students who take all their courses online.
    • Some DE means students who take some but not all of their courses online.
    • At Least One DE is a combination of the above two categories, showing students who take at least one of their courses online.
    • No DE means students not taking any online courses.
    • The data totals used in the report are slightly off (0.07%) from what is in the data set that is the basis for my tables and chart below. I have not figured out this discrepancy yet, but it is immaterial for the big picture.

    For this first post, I am showing totals – institutions in all sectors, and a combination of student enrollment from graduate and undergraduate (4-year, 2-year, and less than 2-year) programs. I’ll break down by sector and level of study and even state in future posts.

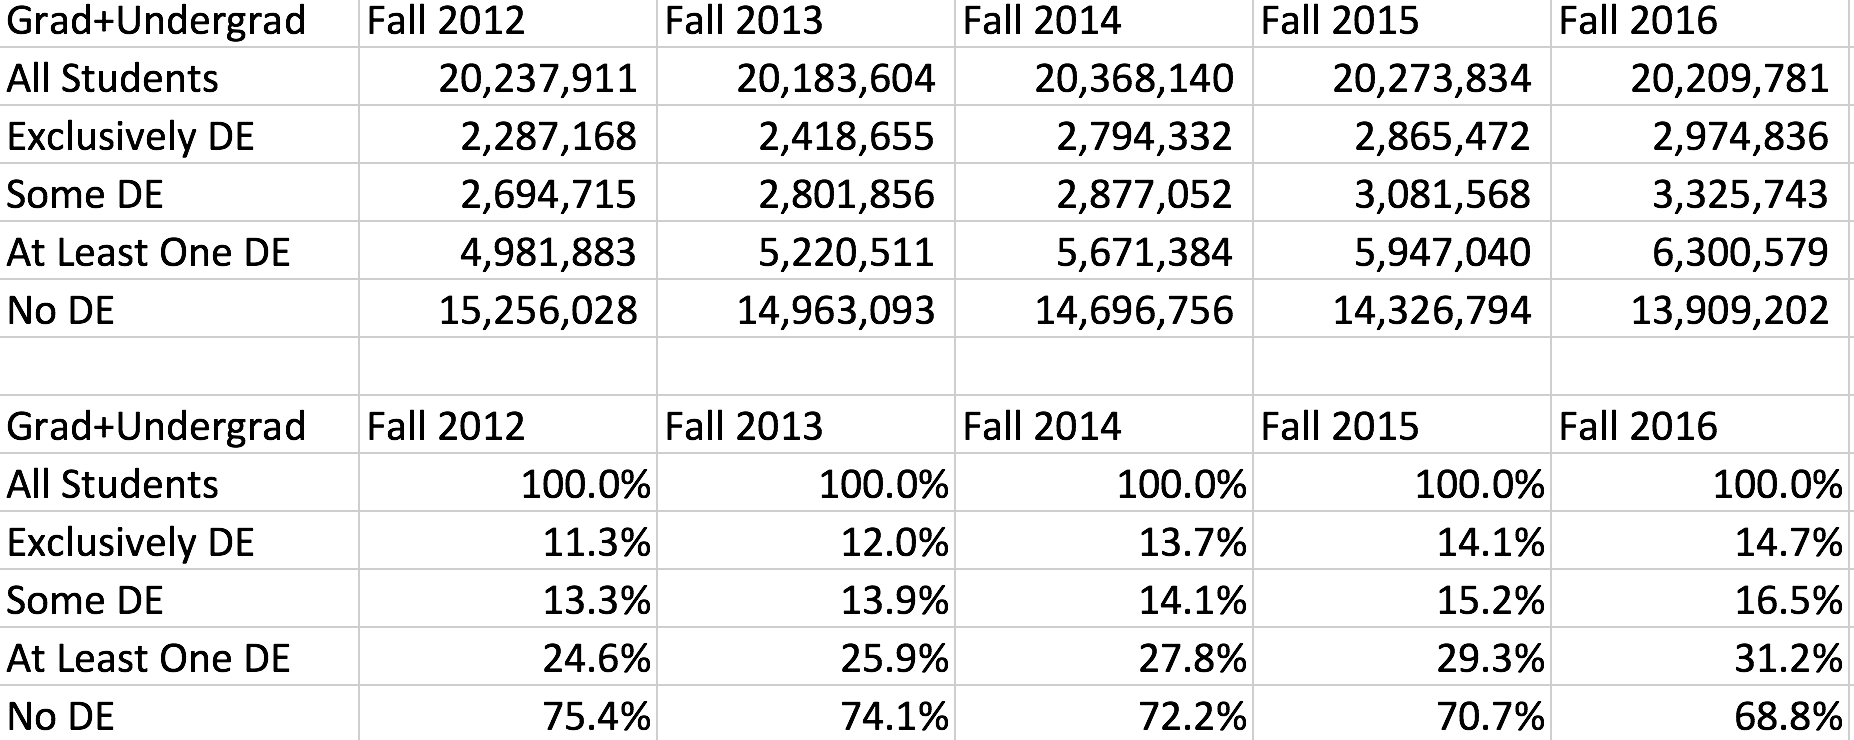
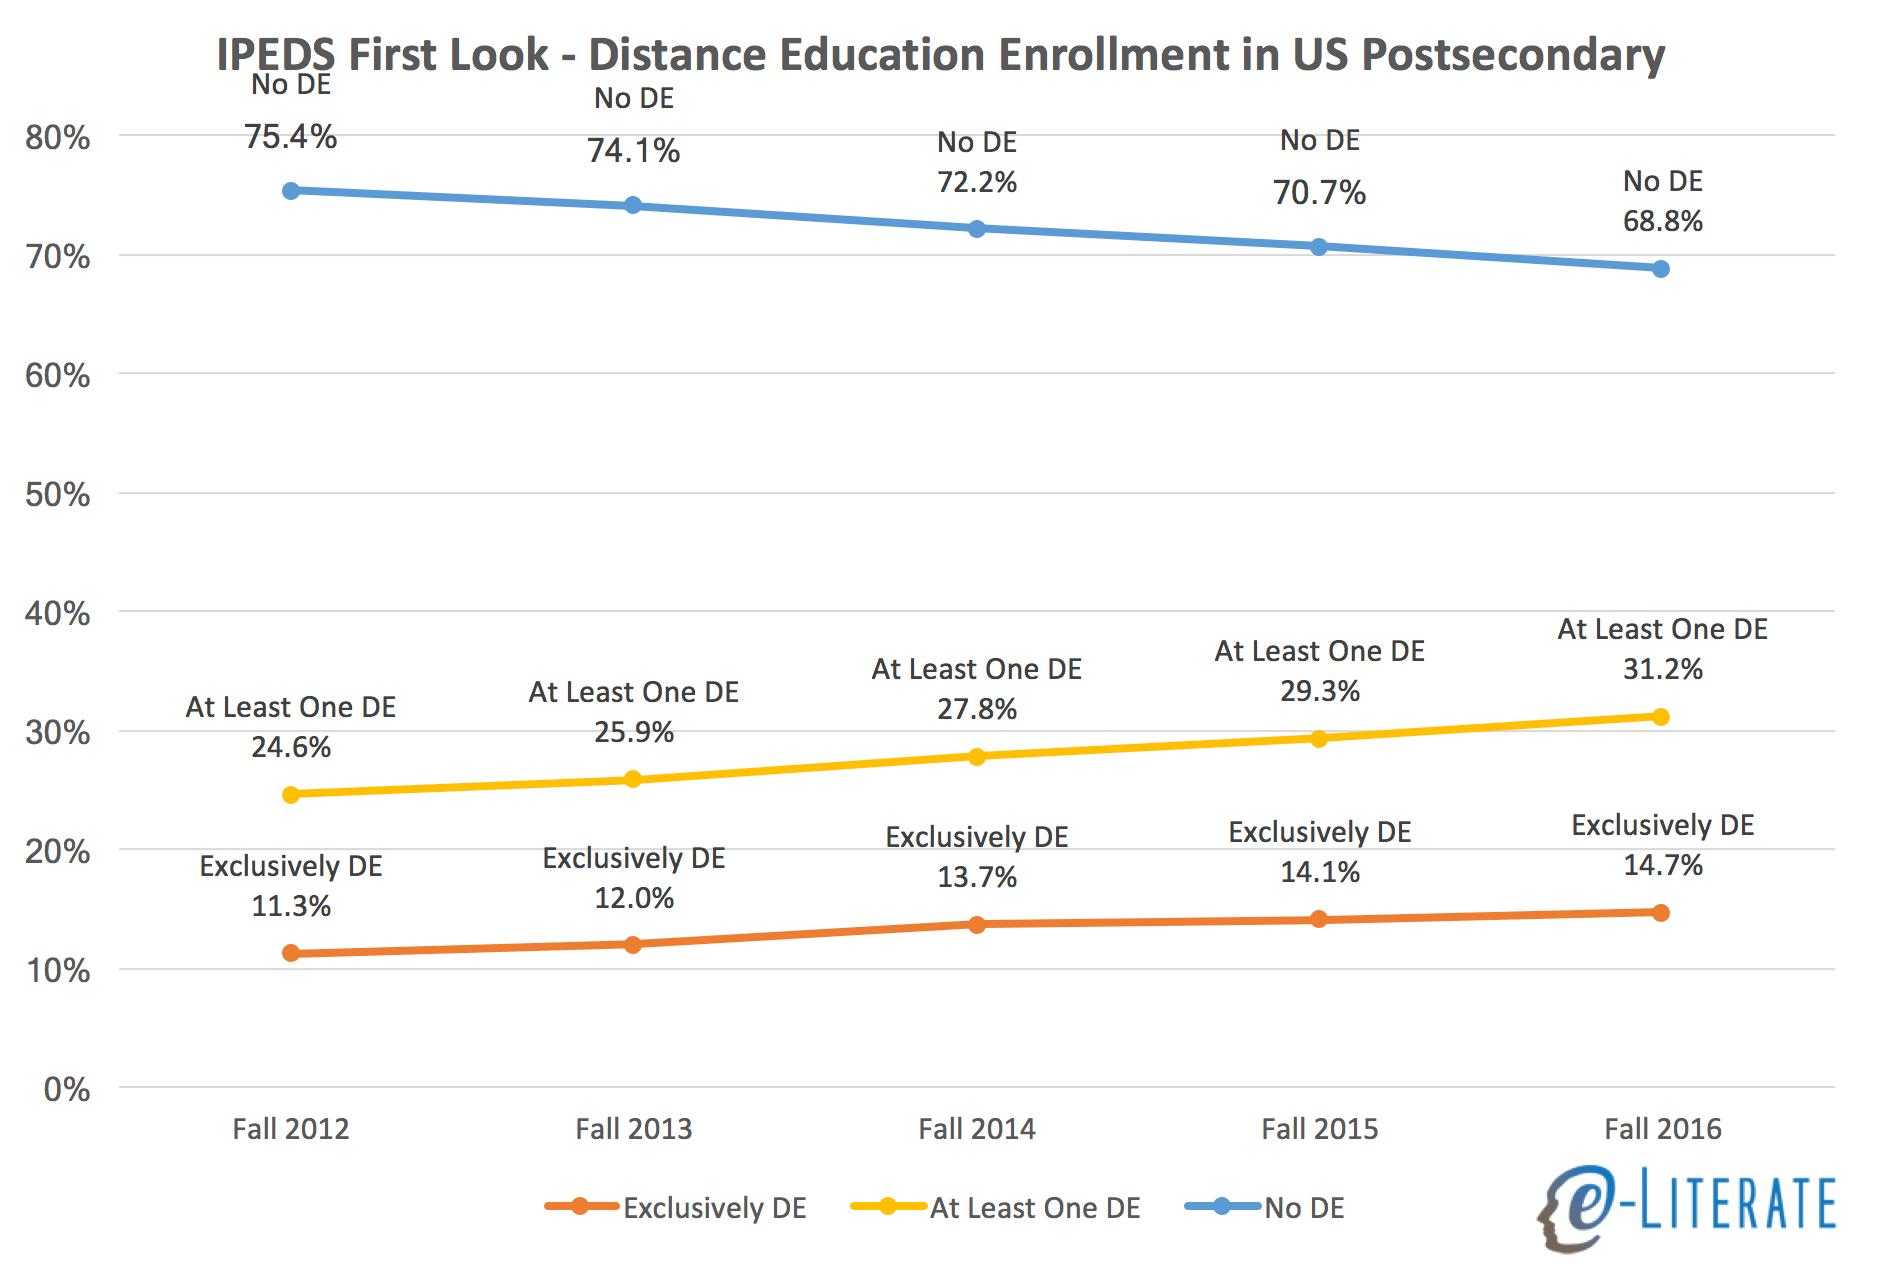
    With all those caveats in mind, here are data from Fall 2012 through 2016.

    Some observations of this data for Fall 2016:

    • There appears to be an small but noticeable acceleration in the growth of DE, going from 1.5% increase in percentage of students taking at least one online course from Fall 2014 to 2015, and a 1.9% increase from Fall 2015 to 2016. Although not shown in these tables, the acceleration appears in both undergraduate and graduate programs.
    • In the four-year period from Fall 2012 to Fall 2016, the share of students taking at least one online course increased by 27% (from 24.6% to 31.2%).
    • Note that this broad view of students (US, Title IV as only filters) does not capture the decrease in total enrollment shown in other IPEDS reports or National Student Clearinghouse reports.

    We’ll look deeper into the data and apply more consistent filtering to allow comparisons to our previous analysis. And we’ll break down by level of study, sector, and home state of institutions.

  • WCET: Clarity into the successful transition of UF Online

    WCET: Clarity into the successful transition of UF Online

    At this year’s annual meeting for WCET, I was on a panel, along with EdSurge’s Jeff Young, moderated by Saint Leo University’s Jeff Borden. Kicking off the panel, Borden framed the discussion partially as learning from those outside academia. Even though I am not an academic, I have found myself making the mistake of a bias against outsiders. Almost two and a half years ago I described the emerging disaster of University of Florida Online (UF Online) – reality was exposing fundamentally flawed enrollment estimates based on institutional and vendor hubris. In this post I described another challenge:

    In the midst of the challenging startup, UF Online had to deal with the premature departure of the initial executive director. After a one-year search process, UF Online chose a new leader who has absolutely no experience in online education.

    That was probably the fifth edit of a paragraph that started closer to “UF Online somehow thought a bureaucrat from EPA should be its new leader. Next up: filling the VP of student support with DMV veteran.” I was wrong – it turns out that choosing an outsider was just what the program needed.

    Further down in the post I noted:

    At this point, it might have been worth stepping back and challenging some of the original assumptions.

    By late 2016, however, I noted a “remarkable transformation at UF Online” and how the unit shed the hubris of the initial plans and really did challenged original assumptions and came up with a new strategy.

    At another WCET session, this same UF Online executive director Evie Cummings provided more insight into the mindset that led to this transformation. Prior to coming to UF Online, Cummings was instrumental in creating and establishing the EPA Information Quality Guidelines and much of the focus was on transparency and accuracy of information shared with the public. This mindset has been brought to the University of Florida, not only leading to an honest reevaluation of original assumptions but also to what I consider exemplary public reporting on program and student outcomes at UF Online.

    Another mindset described in the session was the acceptance of those who control funding – board of governors and state legislators in this case – and figuring out how to use data and communication to bring them along into healthier decision-making.

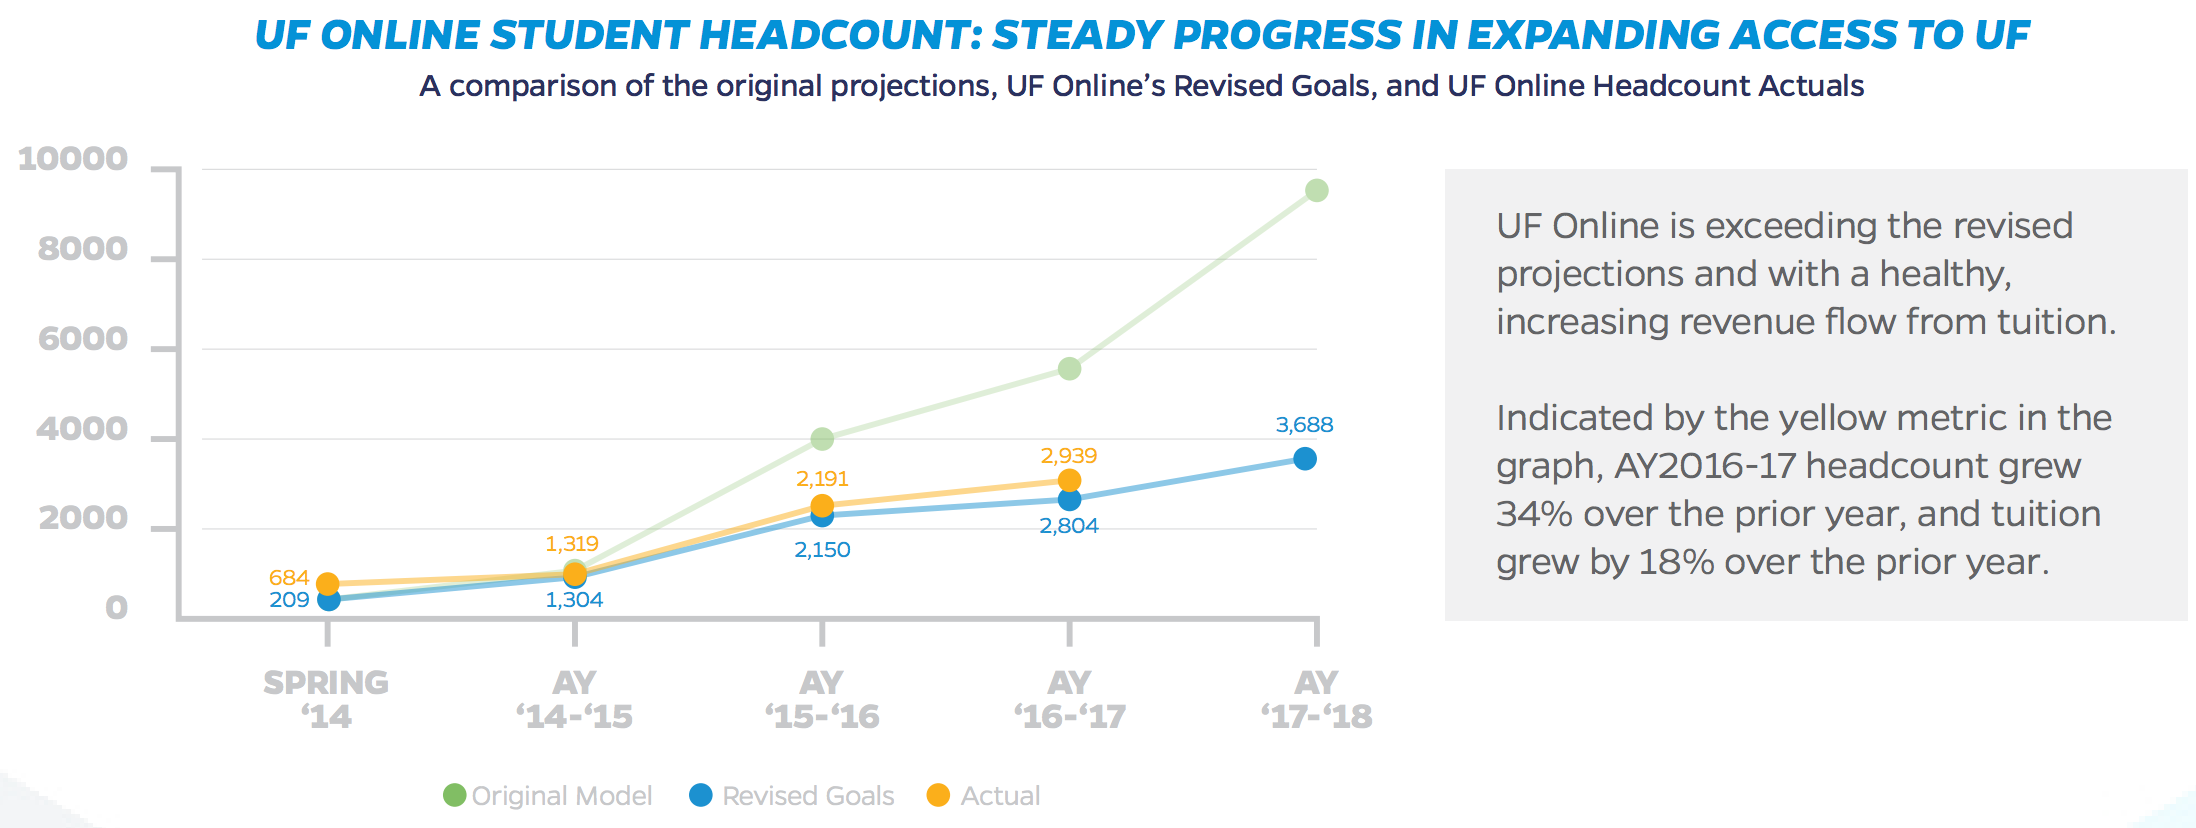
    These approaches are evident in the UF Online annual report released earlier in the week.

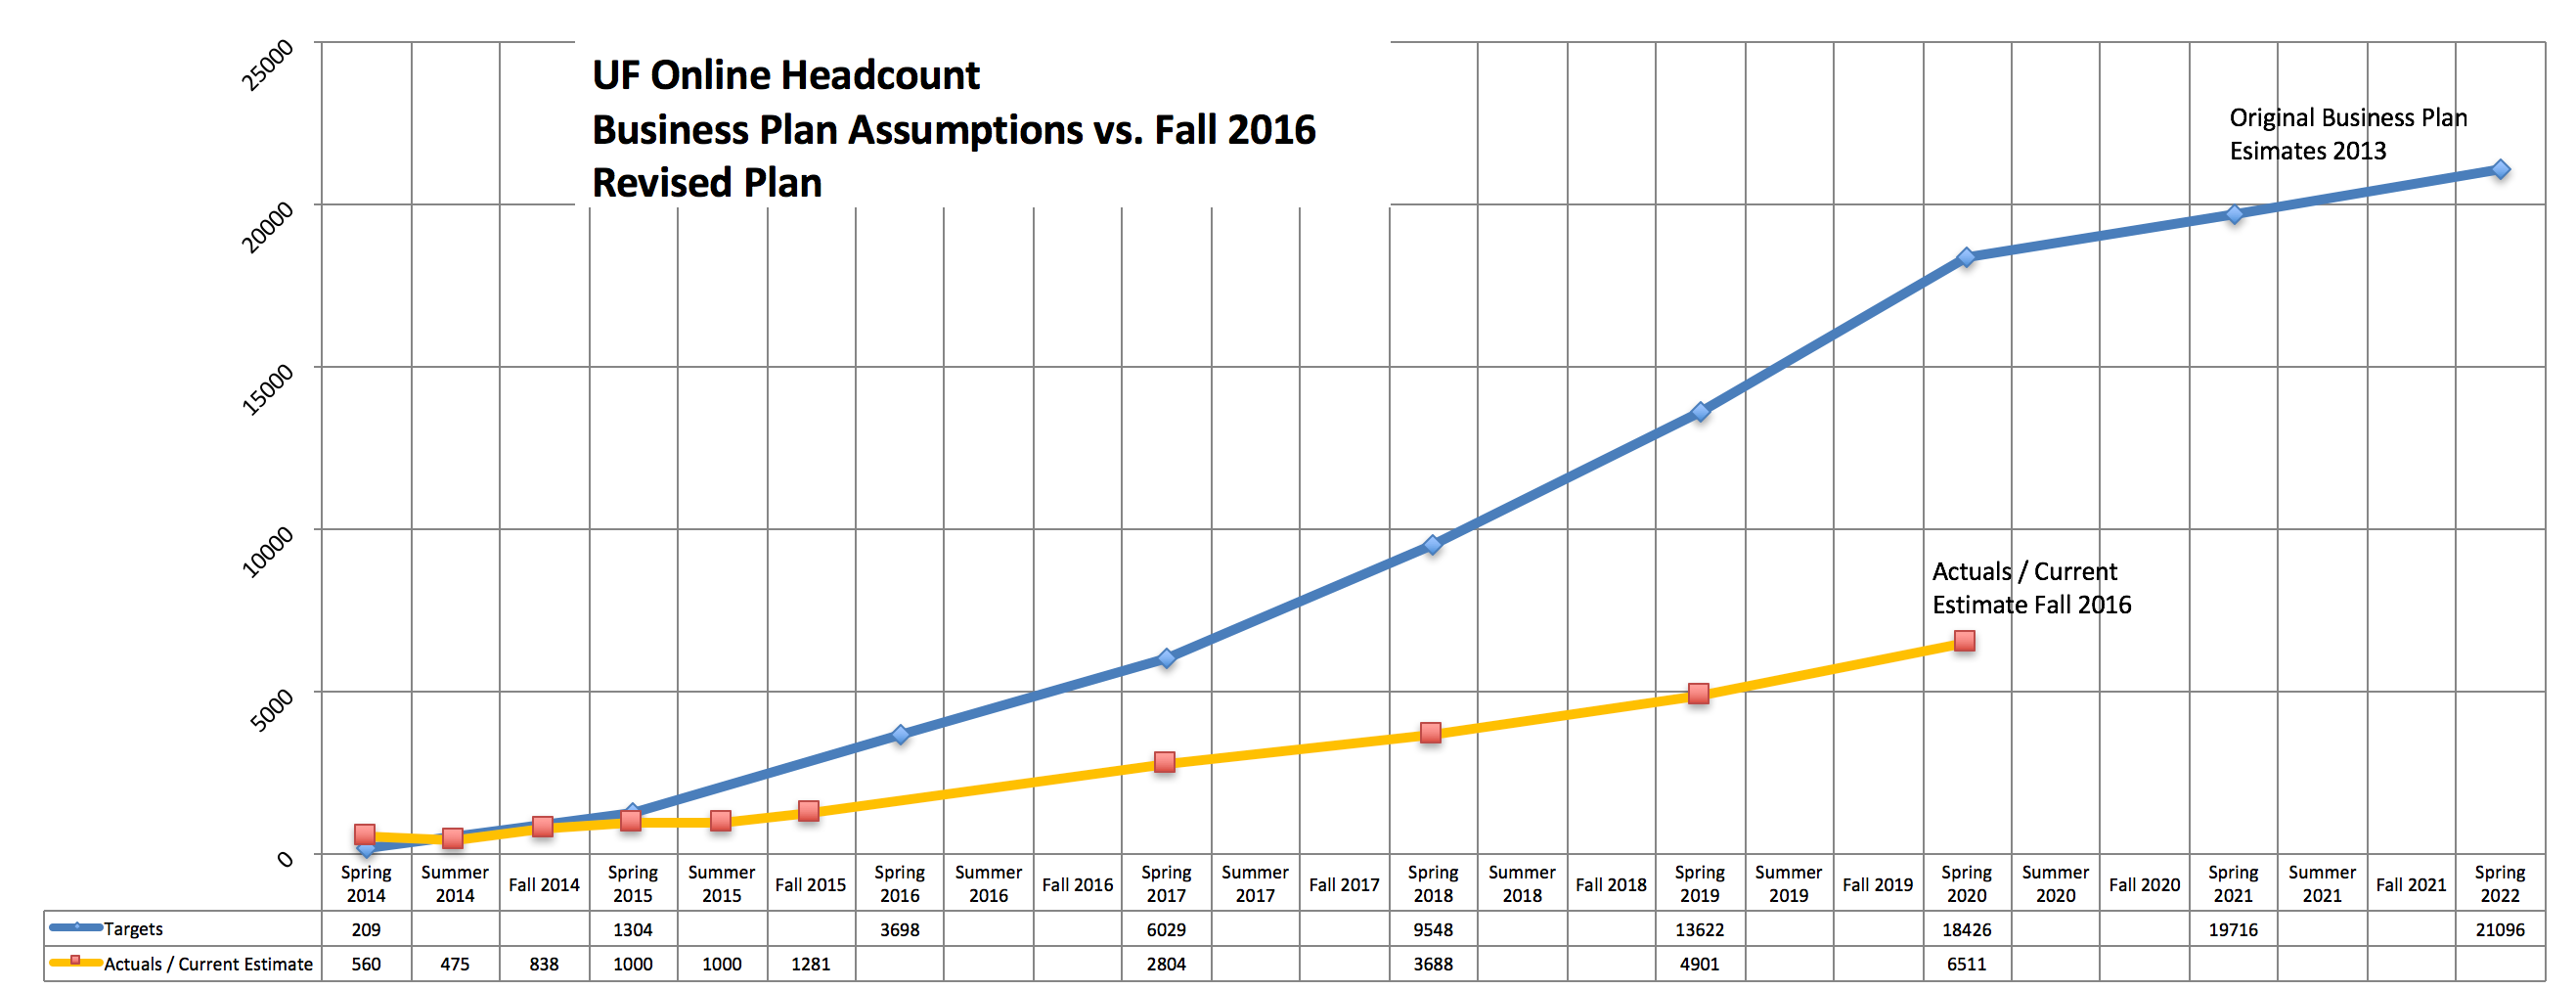
    In terms of enrollment, UF Online not only reports current status and plans, but they choose not to whitewash the past. Their report shows the original plan, the revised plan, and current results with a healthy 34% year-over-year enrollment growth.

    One side benefit – I no longer need to update the spreadsheet I had been using to describe the same information.

    Further in the report, there is a description of UF Online’s new emphasis on creating community among online students and graduates.

    Launched in 2017, the UF Online Connections Program works to foster a thriving learning community across all online students, faculty, academic advisors, and staff. Coupled with strong academic programs, a vibrant and engaged online student experience assures UF Online students not only gain the skills they need but also the connections and network to support them after they graduate. This past year, the Connections program emphasized providing community and networking opportunities with key strategic in-person events.

    They have also launched what they call UF Plaza, a virtual campus to help create social engagement, peer collaboration, and general support groups. Structures outside of the classroom focused on helping online students feel connected.

    One of my previous criticisms was the creation of Pathway to Campus Enrollment (PaCE) – automatic enrollment offers for qualified students who did not get into the main University of Florida as traditional students, with option to transition from online to campus for upper division coursework. When PaCE kicked off, the effort seemed focused mostly on institutional rather than student needs, and students were unprepared for the offer and decision. There was no provision to explain the program and help students decide if they should consider the online option.

    Now UF Online offers a mandatory PaCE Preview:

    This consists of a full day of informational sessions followed by one-on-one sessions with an advisor and concluding with first semester registration.

    They have also added remote site visits:

    We Come to You help sessions: For the first time, in March 2017, UF provided a local site visit in Coral Gables, FL to answer questions about PaCE and help students and their families to make an informed decision.

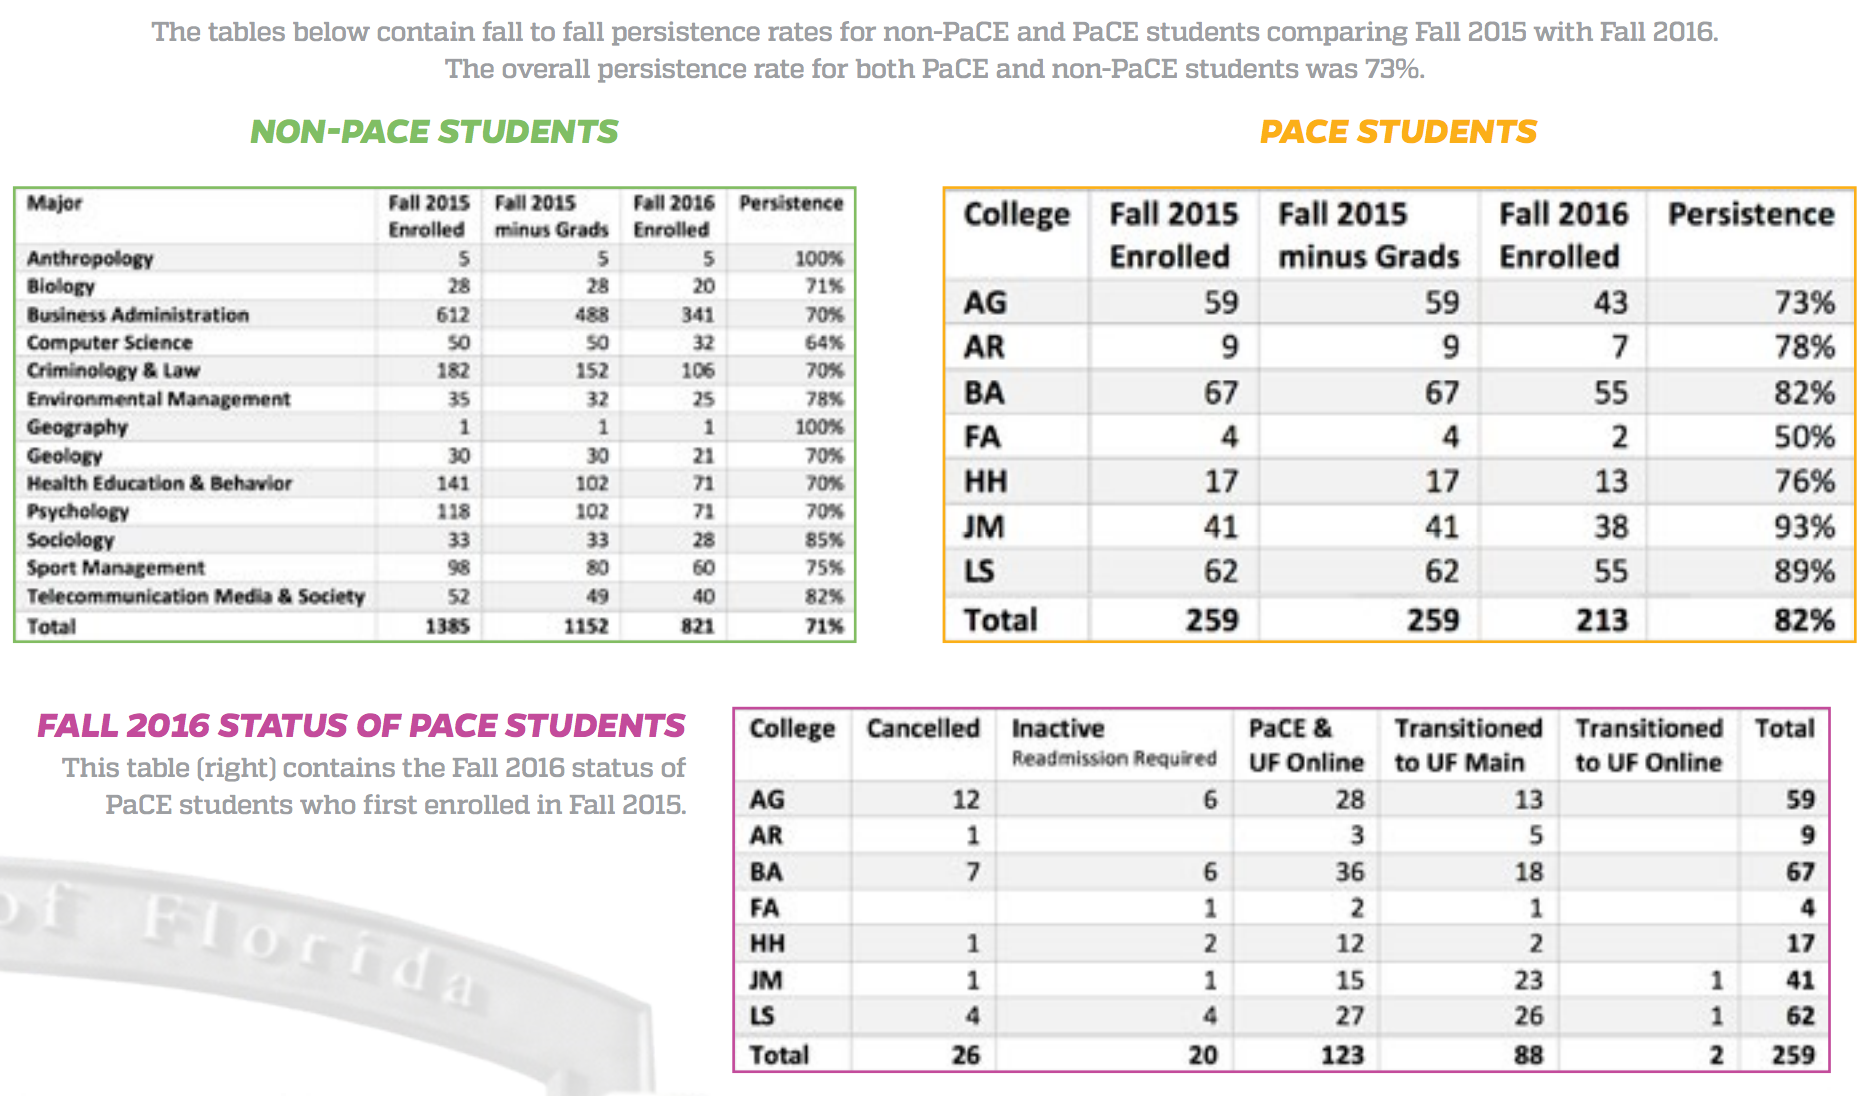
    Given that PaCE students are a different group – they did not initially apply to be an online student – it makes sense that UF Online now reports fall-to-fall persistence data for non-PaCE and PaCE student groups. And they even give a breakdown by academic program and updated status of the PaCE students who enrolled in 2015.

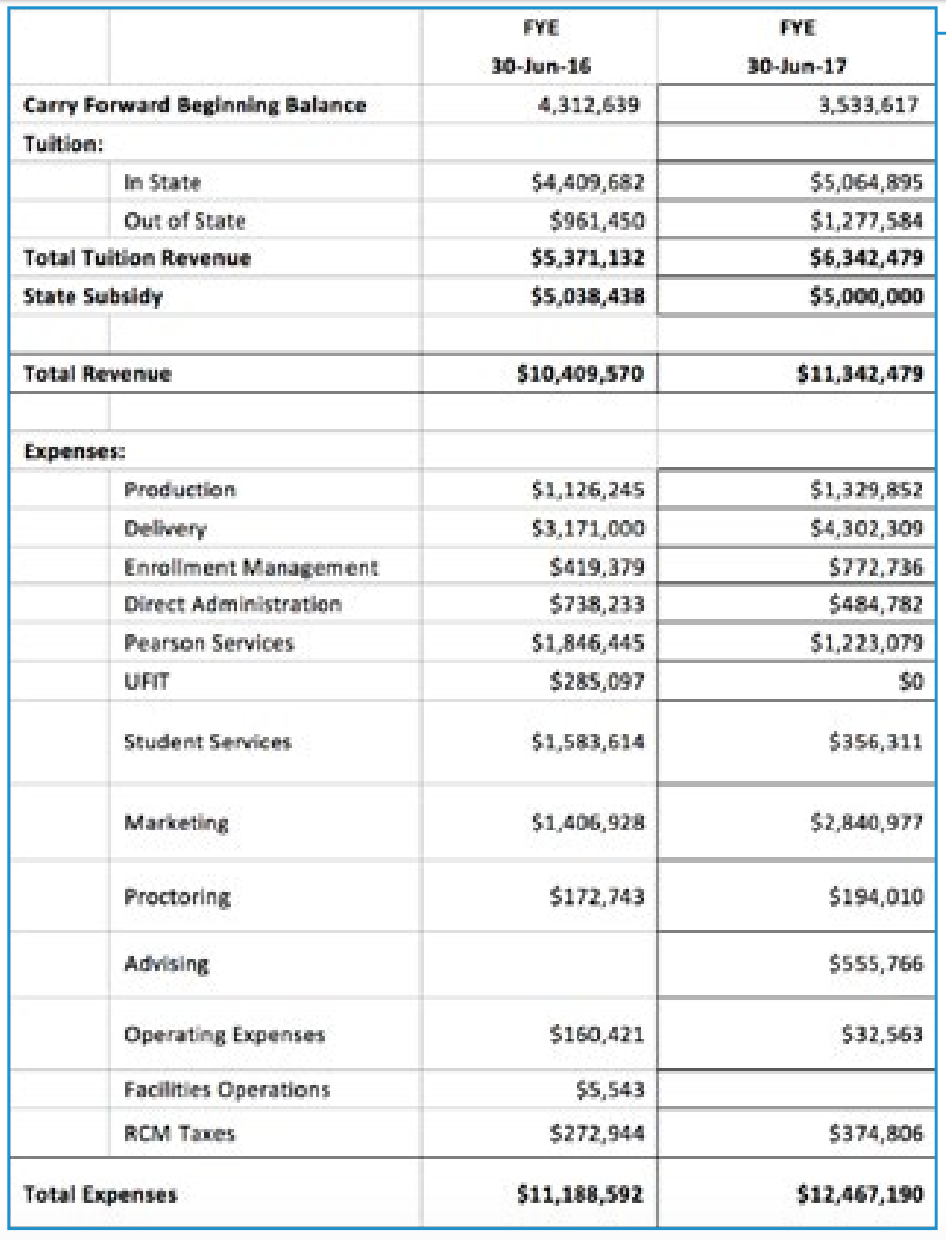
    There are also detailed financials, showing that UF Online is currently bringing in $6.3 m of tuition revenue and $5.0 m of state subsidies and spending $12.5 m.

    UF Online still has challenges – improving persistence rates, getting to break-even financials, etc. And they are not the only online program with this level of success. What makes UF Online so interesting to watch is that they made some hard choices to get past faulty original planning assumptions, they are very transparent in sharing their information publicly, and this is a very positive case of higher education embracing and learning from an outsider.

  • California Should Watch Arkansas Process for Creating New Online Institution

    California Should Watch Arkansas Process for Creating New Online Institution

    Two months ago I wrote a post about Governor Brown’s directive for a fully-online community college in California, noting that:

    What this points to is that for a new fully-online institution to get to some meaningful level of enrollment (let’s say 20,000) in the same ballpark as these comparison schools, I estimate it would take a full decade at the least. This is the reason, by the way, that Mitch Daniels and Purdue University made the Kaplan University deal even though Kaplan’s enrollments are dropping. Daniels did not want to wait a decade to get to meaningful enrollment numbers for an online college serving working adults – if everything works out, within a year Purdue will have a fully-online institution serving 30,000+ working adults. That is a big if, by the way.

    This estimate is probably optimistic, however, based on the outlook for eVersity, the fully-online institution being created in the state of Arkansas. The eVersity leaders have decided that they cannot wait for regional accreditation as reported at Inside Higher Ed today [emphasis added].

    When the University of Arkansas System envisioned creating the online-only institution eVersity in 2014, it planned to follow the well-worn path trodden by other public higher education systems in launching fully online institutions: building on the accreditation of the system’s other universities before seeking independent approval from the regional accreditor.

    But come January, eVersity will seek approval from the Distance Education Accrediting Commission — a national body that overwhelmingly accredits for-profit and nonprofit online institutions — rather than the Higher Learning Commission, which accredits all other public institutions in Arkansas and many nonprofit colleges in 18 other states.

    One of the primary factors shaping eVersity’s decision is speed. The regional accreditor told the university that it could take roughly six years for HLC to award its stamp of approval, while DEAC — assuming it affirms eVersity in January — will have acted in just under two years. Institutional accreditation is required for eVersity students to gain access to federal financial aid, and to ensure that their credentials are valued by employers and others.

    The challenge with national accreditation includes severe limitations on students being able to transfer credits out of the school.

    On the issue of speed, [senior policy analyst at the Center for American Progress] Flores noted that institutions waiting for regional accreditation can often apply for federal aid during the candidacy stage of their application, and that students who attend regionally accredited institutions will have a much easier time transferring their credits than those who attend nationally accredited ones. Flores said eVersity seemed like “a little bit of an odd fit” for DEAC, which typically accredits smaller for-profit institutions that don’t offer federal aid.

    The IHE article (very well-written, by the way) described the path chosen by previous fully-online institutions.

    A more conventional route to regional accreditation, however, is to start as a division of an already regionally accredited campus, said Goldstein. This is what the University of Maryland University College did before obtaining independent regional accreditation. Colorado State University Global Campus also went this route.

    [Chief academic and operating officer of eVersity] Moore said that eVersity decided not to do that, as it did not want to be under the academic and administrative control of another University of Arkansas System institution. “We wanted the ability to be nimble and responsive and not burdened by legacy systems, practices and policies. There are certainly advantages to built-in infrastructures, but they also come with a cost,” said Moore.

    Think about the implications – if a state wants a new, fully-online institution to serve working adults, there seems to be four choices before there is meaningful impact in numbers of students enrolled in institution:

    • Establish new, separate institution, choose regional accreditation, be patient in realistic enrollment growth, and expect 10 – 15 years for meaningful impact
    • Do the above but choose national accreditation and limit transfer ability and possibly impact enrollment, and expect 6 – 11 years
    • Establish division of another school using their accreditation, then spin off for separate institution later on, and risk getting caught up in traditional institution’s legacy policies and practices (unknown timescale)
    • Pull a Mitch Daniels and buy an existing online (or mostly online) institution through creative process, risk not being approved due to transfer of control, and risk getting caught up in the online institution’s legacy policies and practices – and expect 2 – 3 years if the bet works out

    California likely faces similar choices with the fully-online college directive being evaluated this fall. This is a legacy-building project, but there will be real pressure to not have to wait 10 – 15 years to start getting meaningful impact. eVersity from Arkansas is going through this same process ahead of time, and the California team should learn lessons by watching what works and doesn’t work in this case.

    More broadly, the IHE article ends with a key point about accreditation needing to change.

    Russell Poulin, director of policy and analysis at the WICHE Cooperative for Educational Technologies, said that accreditors needed to figure out how to accredit new providers more quickly, without compromising on quality. “Accreditation is slow and innovation is fast; we are starting to see political and business pressure to find alternatives,” he said.

    Read the entire IHE article. This subject is important.

  • Enrollment Implications Regarding Directive for Online Community College in California

    A month ago Governor Jerry Brown directed Eloy Oakley, Chancellor of the California Community College System (CCCS) ((Disclosure: The Online Education Initiative from CCCS is a client of MindWires. The views in this and future posts represents my independent views and not OEI’s.)) to “take whatever steps are necessary” to establish a fully-online college. At first glance this directive appears to be a solution in search of a problem, so it is worth looking beyond the headline see what is motivating this move.

    In an article from Community College Daily:

    Noting that the system has significantly expanded the number of online courses, Brown said, “I believe it is time now for our community colleges to increase even further the availability of online courses and degree programs – and make college far more accessible and affordable.”

    Reaching more students

    “The governor has been interested in realizing the promise of online education for a number of years,” Oakley said in an interview with CCDaily. He added that Brown also wants a way to reach more nontraditional students.

    “We have literally tens of thousands of working adults with some college and no credentials and a couple of million working adults who are unemployed or underemployed,” Oakley said. “This is a wonderful opportunity to reach a population that really needs a community college to achieve economic mobility.”

    The details are not yet worked out, and Oakley is pulling together a group to advise on the options available to make this directive a reality, with the recommendations due in November. Oakley’s comments clearly establish access for nontraditional students to be the ultimate driver. In an interview with Inside Higher Ed, Oakley commented further:

    “Part of this is the governor’s desire to reach more students in California through a technology platform,” said Eloy Ortiz Oakley, chancellor of the California Community College system. “The 114 campuses are designed in a traditional manner, so we’re reaching a traditional population that is students coming out of high schools.”

    But a new online-only college could reach students those traditional brick-and-mortar campuses are currently missing — adults who are unemployed or underemployed, he said.

    To achieve these goals of reaching more working adult students, there are some real challenges to address.

    View of CCCS Enrollment Mix

    It is worth viewing the historical headcount numbers available from the Chancellor’s office, focusing on age group to get a better understanding of the status quo.

    The headcount for CCCS peaked in 2009 at 2.93 million students and has since dropped to the current 2.36 million level, a reduction of 19%. Across the state, colleges are looking for ways to increase, or at least slow the decrease, in overall enrollment.

    What is most striking in the data, however, is the shift from older students (age 25 and above, or “adults”) to younger students (age 24 and blow, or “traditional”) for the community college system, with the mix roughly reversed from 25 years ago. Chancellor Oakley and Governor Brown are right to note that the older student population is not being served well, at least if we use actual enrollment as a proxy. And the situation is getting worse, not better. However, while the majority of students in CCCS are 24 or younger, there are also a large number of older adult students. In other words, there appears to be an overlap between the students in the current 114 colleges and the target students for the new fully-online college. This will present quite a challenge for Oakley and other planners to make the following statement from the IHE interview a reality.

    “We don’t want to cannibalize the system, and we wouldn’t want to create a college to take enrollment from other colleges,” Oakley said. “Any solution would have to complement what we do, and it has to have an opportunity to share revenue with the colleges and really enhance their ability to serve students.”

    This statement is sounds good on paper and will be crucial in terms of getting at least tacit support from the current colleges to the creation of a new, full-online college. But the data shows there is not a clear and easy path to serve adult, non-traditional students without affecting existing colleges.

    National Trends

    In this situation California is not alone. The National Student Clearinghouse research for Fall 2016 shows first that community college (2-year public) enrollments have been dropping nationwide.
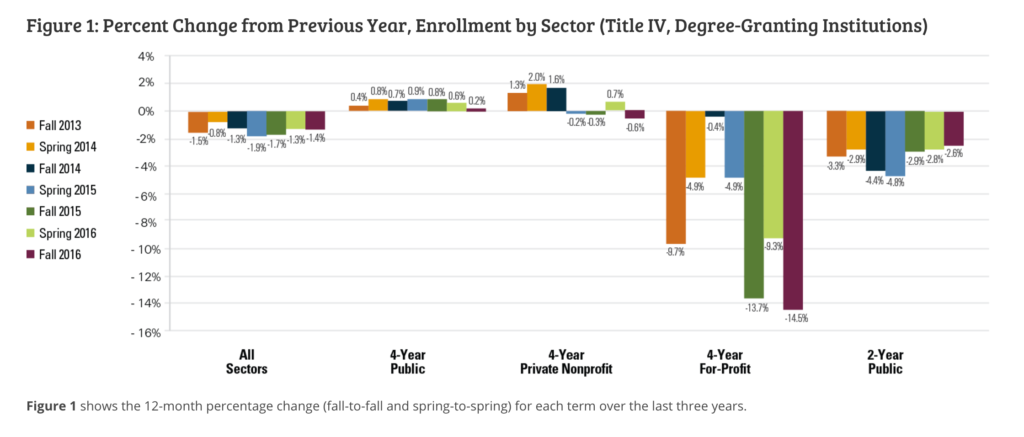
    And just like in California, adult student enrollment has been dropping much faster than 18-24 year old enrollment. 24 and under groups have dropped 1.0 – 2.4% per year while 25 and above groups have dropped 5.5 – 7.6% per year (see bottom two rows).
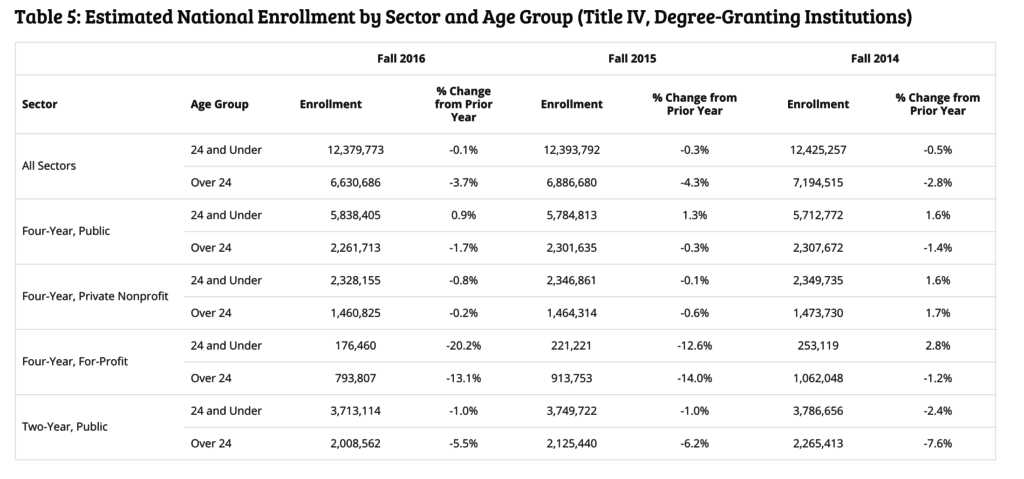
    This will be another challenge for the CCCS planning team, as there is no indication that California is screwing up while other states have the same problem figured out – the reduction in community college enrollments, particularly for adult students, appears to be a nationwide demographic trend.

    Comparison Colleges

    Assuming that the plan works out and they find new enrollment opportunities that don’t cannibalize existing college student groups, it is also worth considering how large this college might become. I pulled together the IPEDS data for several of the top-growing online undergraduate colleges ((The comparison colleges might not be exclusively online, but they have become at least predominantly online.)) to get some idea of what the best-case scenario might be in terms of enrollment growth. This data looks at fall enrollment numbers which will be lower than full-year headcount numbers.
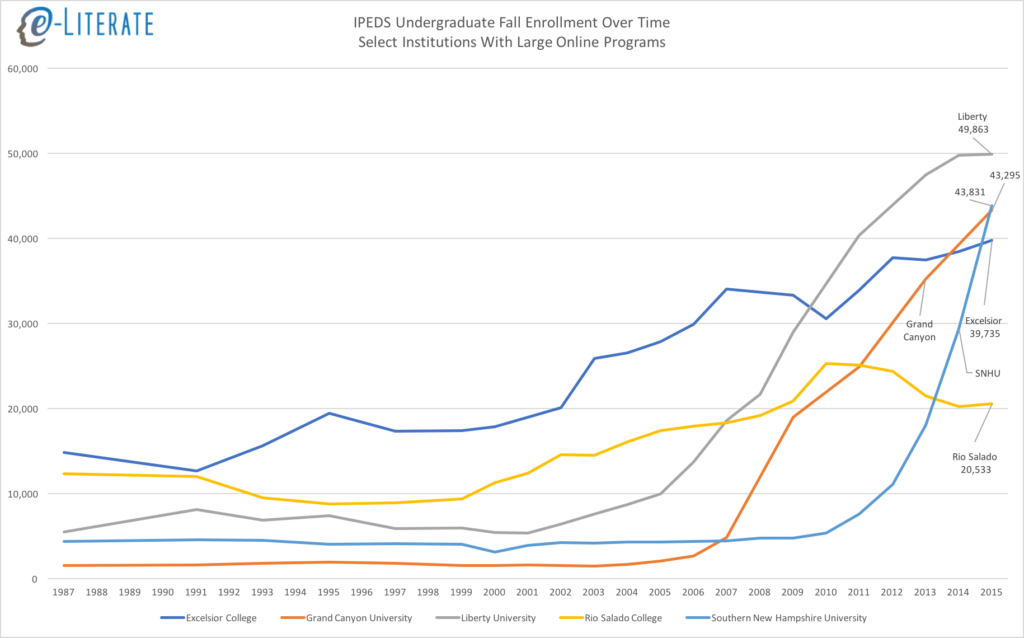
    Once we get past the “holy crap, look at Southern New Hampshire University’s (SNHU) growth”, there are a few observations to make.

    • We’ll have to see where SNHU goes, but there has traditionally been a ceiling to the size of online enrollment per institution of around 80,000 – 100,000. The primary exception has been the University of Phoenix that reached a quarter of a million online students back in 2010, but their enrollment has been dropping since then and are more of the exception that proves the rule. All others have peaked well under 100,000 students. Just this spring Liberty University experienced their first recent enrollment drop, leading to staff layoffs.
    • The maximum growth rate of these cherry-picked successful schools ranges from ~1,200 / year for Excelsior to ~7,700 / year for SNHU (note that Rio Salado at ~1,400 / year is the only public institution). Add to this the fact that all of these schools have been around for decades. No accreditation issues, no time-consuming establishment of core leadership team, etc.
    • There is a big difference in dealing with institutional issues and statewide issues, particularly in California. One in five US community college students in the US do so in California, and the statewide issues tend to come in large numbers. Statewide issues tend to come in hundreds of thousands while institutional issues tend to come in tens of thousands.

    What this points to is that for a new fully-online institution to get to some meaningful level of enrollment (let’s say 20,000) in the same ballpark as these comparison schools, I estimate it would take a full decade at the least. This is the reason, by the way, that Mitch Daniels and Purdue University made the Kaplan University deal even though Kaplan’s enrollments are dropping. Daniels did not want to wait a decade to get to meaningful enrollment numbers for an online college serving working adults – if everything works out, within a year Purdue will have a fully-online institution serving 30,000+ working adults. That is a big if, by the way.

    None of this analysis is to argue that CCCS should not try to establish a fully-online college. The goal of better serving nontraditional populations – adult students with and without jobs – is worth pursuing on its own merits.

    The numbers do argue, however, for a realistic view on the challenges they face:

    • Fighting against national demographic trends for adult students of community colleges;
    • Trying to avoid cannibalizing enrollment from existing California Community Colleges;
    • Having the patience to support the schools while it take years to grow to a size with meaningful enrollment levels; and
    • Accepting that best case this approach probably recovers less than 10% of the enrollment drop since 2009.

    I would hope that the CCCS planning efforts take the hard numbers into consideration when searching for different options to satisfy the governor’s directive.

  • Do For-profit Institutions Converting to Non-profit Affect Distance Education Enrollment Numbers?

    Do For-profit Institutions Converting to Non-profit Affect Distance Education Enrollment Numbers?

    In a comment to my post on the new Digital Learning Compass report covering distance education enrollment trends for US higher education, Richard Garrett, Chief Research Officer at Eduventures and Director at The Observatory on Borderless Higher Education, asked an interesting question.

    I’d welcome your view on a related issue I’ve been wrestling with, namely how to treat for-profit institutions with significant numbers of online students that are now nonprofit. A number made such a conversion in the fall 2012-15 period, and more are to come (e.g. the EDMC and Kaplan announcements). In your study, did you use institutional control for the year concerned or continue to treat former for-profits as such? If the former, then I think it is worth pointing out that some of the private nonprofit growth, and for-profit decline, is due to control conversion.

    With all of the news around for-profit changes, include Corinthian Colleges, ITT, Kaplan University, DeVry rebranding, I thought it would be worth addressing this question in a new post instead of just in the comments as I suspect others may have the same question.

    tl;dr – There has been no material effect of these institutional control changes for the periods covered in the DL Compass report (Fall 2012 through Fall 2015). (more…)