e-Literate

Present is Prologue

Author: Phil Hill

  • Fall 2014 IPEDS Data: Interactive table ranking DE programs by enrollment

    Last week I shared a static view of the US institutions with the 30 highest enrollments of students taking at least one online (distance ed, or DE) course. But we can do better than that, thanks to some help from Justin Menard at LISTedTECH and his Tableau guidance.

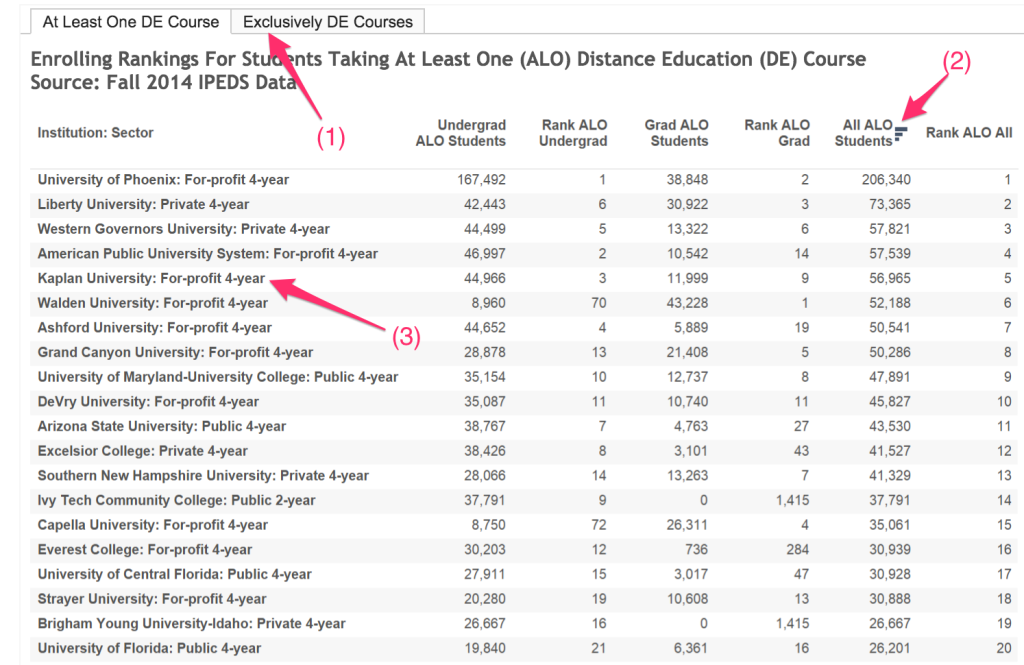
    The following interactive chart allows you to see the full rankings based on undergraduate, graduate and combined enrollments. And it has two views – one for students taking at least one online course and one for exclusive online students. Note the following:

    Tableau hints

    • (1) shows how you can change views by selecting the appropriate tab.
    • (2) shows how you can sort on any of the three measures (hover over the column header).
    • (3) shows the sector for each institution by the institution name.

    (more…)

  • Fall 2014 IPEDS Data: Top 30 largest online enrollments per institution

    The National Center for Educational Statistics (NCES) and its Integrated Postsecondary Education Data System (IPEDS) provide the most official data on colleges and universities in the United States. This is the third year of data.

    Let’s look at the top 30 online programs for Fall 2014 (in terms of total number of students taking at least one online course). Some notes on the data source:

    • I have combined the categories ‘students exclusively taking distance education courses’ and ‘students taking some but not all distance education courses’ to obtain the ‘at least one online course’ category;
    • Each sector is listed by column;
    • IPEDS tracks data based on the accredited body, which can differ for systems – I manually combined most for-profit systems into one institution entity as well as Arizona State University[1];
    • See this post for Fall 2013 Top 30 data and see this post for Fall 2014 profile by sector and state.

    Fall 2014 Top 30 Largest Online Enrollments Per Institution (more…)

  • Fall 2014 IPEDS Data: New Profile of US Higher Ed Online Education

    The National Center for Educational Statistics (NCES) and its Integrated Postsecondary Education Data System (IPEDS) provide the most official data on colleges and universities in the United States. I have been analyzing and sharing the data in the initial Fall 2012 dataset and for the Fall 2013 dataset. Both WCET and the Babson Survey Research Group also provide analysis of the IPEDS data for distance education. I highly recommend the following analysis in addition to the profile below (we have all worked together behind the scenes to share data and analyses).

    Below is a profile of online education in the US for degree-granting colleges and university, broken out by sector and for each state. (more…)

  • A Moment of Clarity on the Role of Technology in Teaching

    This following excerpt is based on a post first published at The Chronicle of Higher Education.

    With all of the discussion around the role of online education for traditional colleges and universities, over the past month we have seen reminders that key concerns are about people and pedagogy, not technology. And we can thank two elite universities that don’t have large online populations — MIT and George Washington University — for this clarity.

    On April 1, the MIT Online Education Policy Initiative released its report,“Online Education: A Catalyst for Higher Education Reforms.” The Carnegie Corporation-funded group was created in mid-2014, immediately after an earlier initiative looked at the future of online education at MIT. The group’s charter emphasized a broader policy perspective, however, exploring “teaching pedagogy and efficacy, institutional business models, and global educational engagement strategies.”

    While it would be easy to lament that this report comes from a university with few online students and yet dives into how online learning fits in higher education, it would be a mistake to dismiss the report itself. This lack of “in the trenches” experience with for-credit online education helps explain the report’s overemphasis on MOOCs and its underemphasis on access and nontraditional learner support. Still, the MIT group did an excellent job of getting to some critical questions that higher-education institutions need to address. Chief among them is the opportunity to use online tools and approaches to instrument and enable enhanced teaching approaches that aren’t usually possible in traditional classrooms. (more…)

  • Blackboard CEO’s First 100 Days: Reorganization and Learn Ultra Updates

    Just over four years after Providence Equity Partners acquired Blackboard and three years after they brought in Jay Bhatt to replace co-founder Michael Chasen, the company hired Bill Ballhaus as its new CEO at the beginning of January. 100 days in, Ballhaus is starting to make changes to the organization and providing some insights into future corporate directions.

    The most significant change is a reorganization that combines strategy, product management and marketing in one group under Katie Blot. In an interview Michael and I had with Ballhaus and Blot earlier this week, they described the primary motivation for the organizational change as the need to more tightly align those functions. Also significant is that this change means the departure of Mark Strassman, SVP Product Marketing & Management, and Tracey Stout, SVP of Marketing & Sales Effectiveness. Blackboard provided the following statement. (more…)

  • State of Higher Ed LMS Market for US and Canada: Spring 2016 Edition

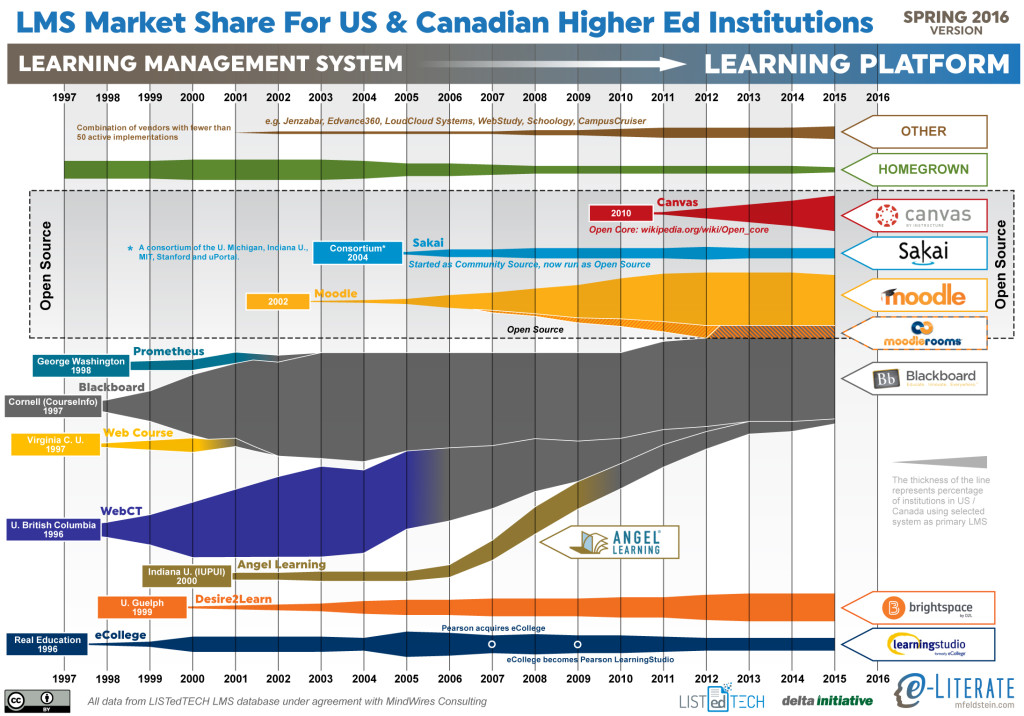
    This is the eighth year I have shared the LMS market share graphic, commonly known as the squid graphic, for (mostly) US higher education. The original idea remains – to give a picture of the LMS market in one page, highlighting the story of the market over time. The key to the graphic is that the width of each band represents the percentage of institutions using a particular LMS as its primary system.

    This year marks a significant change based on our upcoming LMS subscription service. We are working with LISTedTECH to provide market data and visualizations. This data source provides historical and current measures of institutional adoptions, allowing new insights into how the market has worked and current trends. This current graphic gets all of its data from LISTedTECH. Where previous versions of the graphic used an anchoring technique, combining data from different sources in different years, with interpolation where the data was unavailable. Now, every year’s data is based on this single data source.

    This graphic has been in the public domain for years, however, and we think it best to keep it that way. In this way we hope that the new service will provide valuable insight for subscribers but also improve what we continue to share here on the e-Literate blog.

    Since we have data over time now and not just snapshots, we have picked the end of each year for that data. For this reason, the data goes through the end of 2015. We have 2016 data but chose not to share partial-year results in an effort to avoid confusion.
    LMS_MarketShare_20160316

    A few items to note:

    • As noted in previous years, the fastest-growing LMS is Canvas. There is no other solution close in terms of matching the Canvas growth.
    • Blackboard continues to lose market share, although the vast majority of that reduction over the past two years has been from customers leaving ANGEL. Blackboard Learn lost only a handful of clients in the past year.
    • While the end-of-life occurs next year, Pearson’s has announced LearningStudio’s end-of-life for the end of 2017.
    • With the new data set, the rapid rise and market strength of WebCT becomes much more apparent than previous graphics.
    • There is a growing line for “Other”, capturing the growth of those systems with less than 50 active implementations as primary systems; systems like Jenzabar, Edvance360, LoudCloud Systems, WebStudy, Schoology, and CampusCruiser.
    • While we continue to show Canvas in the Open Source area, we have noted a more precise description as an Open Core model.

    For a better description of the upcoming LMS subscription service, read this post and / or sign up for more information here.

  • Signup For More Information On LMS Subscription Service

    As we roll out our upcoming LMS subscription service here at e-Literate (see Michael’s post for initial description), we suspect that many of the e-Literate readers will be interested, but not all. We value the community here at e-Literate and want to ensure that the blog site itself remains as it’s always been – ad free, uncluttered, and with the same rough amount and breadth of content and discussions.

    To help maintain the blog site’s feel, we have created a second email subscription for those people who would like more information on the LMS subscription service – when it’s going to be available, what the reports will look like, summaries of LMS analysis from the report and curated from the blog site, etc. You should see this new signup on the top of the right column in the desktop view, right under the signup for e-Literate posts. We will also include the form within posts that are relevant to analysis of the LMS market.

    We are not going to automatically add current e-Literate subscribers to this new list, so if you’re interested in learning more on the service and getting content updates, sign up for the new subscription at this link.

    Update: I apologize for any confusion as we test the signup button. The fields embedded in the post were not working in all cases, so we have replaced with a link to a web signup page. Thank you for your patience as we fix any remaining issues.